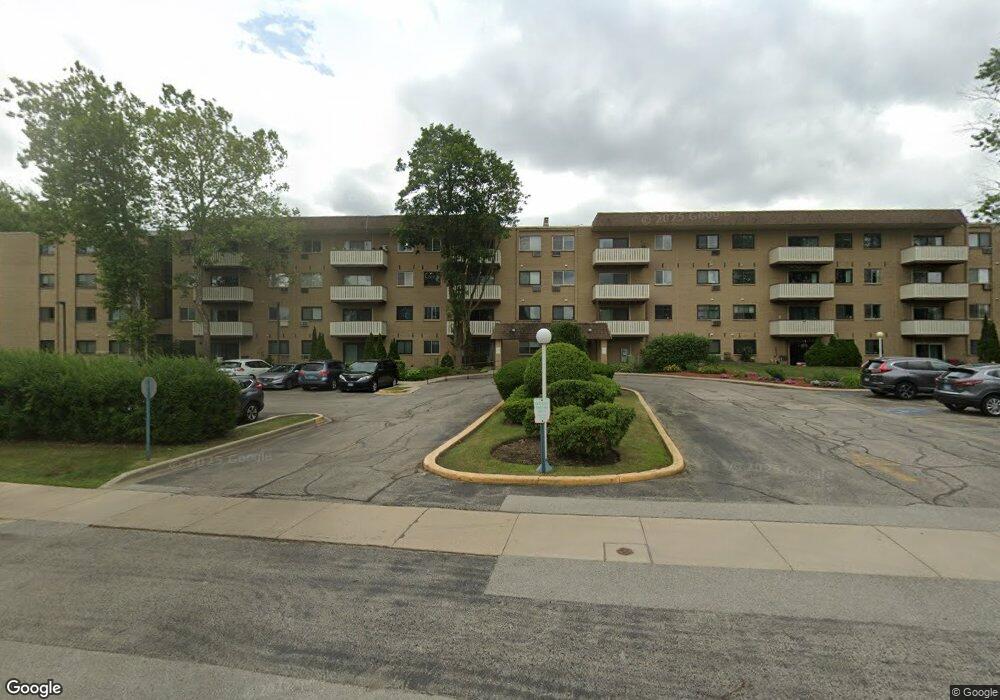
290 N Westgate Rd Unit 107 Mount Prospect, IL 60056
North Mount Prospect NeighborhoodEstimated Value: $164,000 - $216,000
2
Beds
1
Bath
156,720
Sq Ft
$1/Sq Ft
Est. Value
About This Home
This home is located at 290 N Westgate Rd Unit 107, Mount Prospect, IL 60056 and is currently estimated at $195,393, approximately $1 per square foot. 290 N Westgate Rd Unit 107 is a home located in Cook County with nearby schools including Indian Grove Elementary School, River Trails Middle School, and John Hersey High School.
Ownership History
Date
Name
Owned For
Owner Type
Purchase Details
Closed on
May 5, 2010
Sold by
Deutsche Bank National Trust Company
Bought by
Alvarado Ivan
Current Estimated Value
Home Financials for this Owner
Home Financials are based on the most recent Mortgage that was taken out on this home.
Original Mortgage
$88,804
Interest Rate
5.25%
Mortgage Type
FHA
Purchase Details
Closed on
Oct 30, 2009
Sold by
Yoo Soo Hee and Yoo Soo H
Bought by
Deutsche Bank National Trust Company
Purchase Details
Closed on
Sep 30, 2003
Sold by
Suarez Rene M
Bought by
Yoo Soo Hee
Home Financials for this Owner
Home Financials are based on the most recent Mortgage that was taken out on this home.
Original Mortgage
$119,200
Interest Rate
7.39%
Mortgage Type
Purchase Money Mortgage
Purchase Details
Closed on
Dec 5, 1997
Sold by
Westgate Llc
Bought by
Suarez Rene M
Home Financials for this Owner
Home Financials are based on the most recent Mortgage that was taken out on this home.
Original Mortgage
$70,300
Interest Rate
7.26%
Create a Home Valuation Report for This Property
The Home Valuation Report is an in-depth analysis detailing your home's value as well as a comparison with similar homes in the area
Home Values in the Area
Average Home Value in this Area
Purchase History
| Date | Buyer | Sale Price | Title Company |
|---|---|---|---|
| Alvarado Ivan | $90,000 | First American Title | |
| Deutsche Bank National Trust Company | -- | None Available | |
| Yoo Soo Hee | $149,000 | Pntn | |
| Suarez Rene M | $88,000 | -- |
Source: Public Records
Mortgage History
| Date | Status | Borrower | Loan Amount |
|---|---|---|---|
| Previous Owner | Alvarado Ivan | $88,804 | |
| Previous Owner | Yoo Soo Hee | $119,200 | |
| Previous Owner | Suarez Rene M | $70,300 | |
| Closed | Yoo Soo Hee | $29,800 |
Source: Public Records
Tax History
| Year | Tax Paid | Tax Assessment Tax Assessment Total Assessment is a certain percentage of the fair market value that is determined by local assessors to be the total taxable value of land and additions on the property. | Land | Improvement |
|---|---|---|---|---|
| 2025 | $3,194 | $19,483 | $2,087 | $17,396 |
| 2024 | $3,194 | $14,059 | $1,788 | $12,271 |
| 2023 | $3,034 | $14,059 | $1,788 | $12,271 |
| 2022 | $3,034 | $14,059 | $1,788 | $12,271 |
| 2021 | $3,049 | $12,605 | $248 | $12,357 |
| 2020 | $3,021 | $12,605 | $248 | $12,357 |
| 2019 | $3,041 | $14,059 | $248 | $13,811 |
| 2018 | $1,781 | $9,010 | $198 | $8,812 |
| 2017 | $1,804 | $9,010 | $198 | $8,812 |
| 2016 | $1,956 | $9,010 | $198 | $8,812 |
| 2015 | $1,334 | $6,708 | $844 | $5,864 |
| 2014 | $1,330 | $6,708 | $844 | $5,864 |
| 2013 | $690 | $6,708 | $844 | $5,864 |
Source: Public Records
Map
Nearby Homes
- 130 N Horner Ln
- 908 E Central Rd
- 576 Amherst Ave
- 404 Tracy Terrace
- 608 N Eastman Dr
- 218 N School St
- 1100 N Boxwood Dr Unit P4P5P6
- 475 Amherst Ave
- 406 N Elm St
- 586 N 7th Ave Unit 4
- 932 N Wheeling Rd
- 601 E Hackberry Ln
- 410 E Garwood Ave
- 1008 N Newberry Ln
- 420 Radcliffe Ave
- 793 Timothy Ln
- 612 Maple Ct
- 17 S Maple St
- 215 N Main St
- 304 Amherst Ave
- 290 N Westgate Rd Unit 416
- 290 N Westgate Rd Unit 306
- 290 N Westgate Rd Unit 302
- 290 N Westgate Rd Unit 102
- 290 N Westgate Rd Unit 108
- 290 N Westgate Rd Unit 313
- 290 N Westgate Rd Unit 413
- 290 N Westgate Rd Unit 303
- 290 N Westgate Rd Unit 408
- 290 N Westgate Rd Unit 307
- 290 N Westgate Rd Unit 301
- 290 N Westgate Rd Unit 204
- 290 N Westgate Rd Unit 115
- 290 N Westgate Rd Unit 215
- 290 N Westgate Rd Unit 211
- 290 N Westgate Rd Unit 217
- 290 N Westgate Rd Unit 210
- 290 N Westgate Rd Unit 201
- 290 N Westgate Rd Unit 111
- 290 N Westgate Rd Unit 412
Your Personal Tour Guide
Ask me questions while you tour the home.