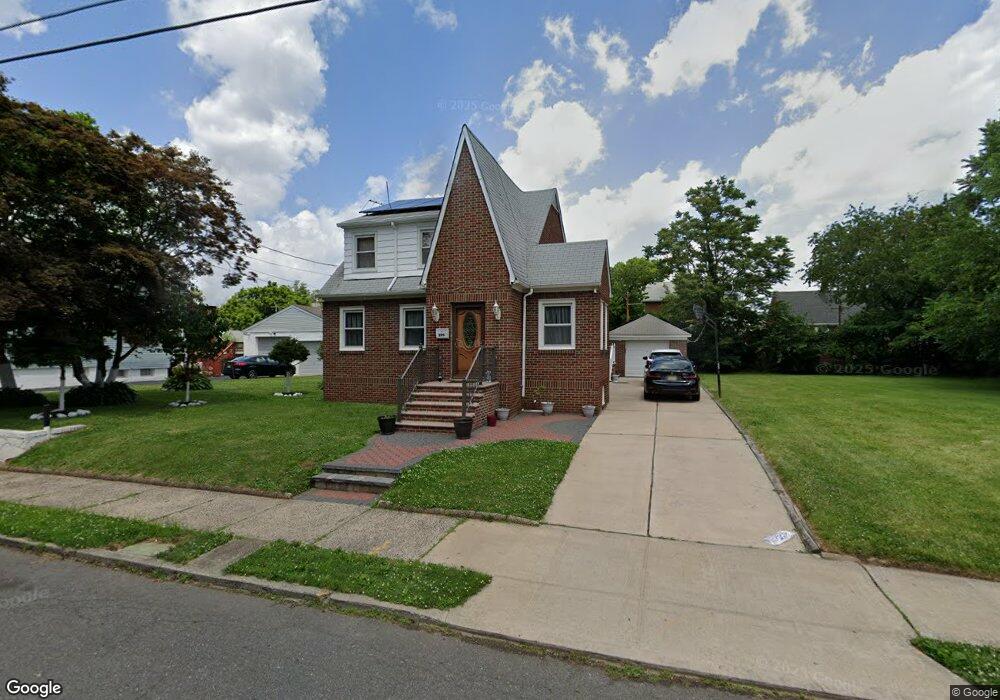
290 Randolph St Carteret, NJ 07008
Estimated Value: $578,000 - $775,000
--
Bed
--
Bath
1,823
Sq Ft
$351/Sq Ft
Est. Value
About This Home
This home is located at 290 Randolph St, Carteret, NJ 07008 and is currently estimated at $639,698, approximately $350 per square foot. 290 Randolph St is a home located in Middlesex County with nearby schools including Carteret High School and St Joseph School.
Ownership History
Date
Name
Owned For
Owner Type
Purchase Details
Closed on
Nov 22, 2002
Sold by
Petracca Domenico
Bought by
Singh Sukhjinder and Dhesi Jagvir Kaur
Current Estimated Value
Home Financials for this Owner
Home Financials are based on the most recent Mortgage that was taken out on this home.
Original Mortgage
$185,250
Interest Rate
6.19%
Purchase Details
Closed on
Dec 13, 1995
Sold by
Yannetti Faith
Bought by
Singh Jasvir
Home Financials for this Owner
Home Financials are based on the most recent Mortgage that was taken out on this home.
Original Mortgage
$60,000
Interest Rate
7.33%
Create a Home Valuation Report for This Property
The Home Valuation Report is an in-depth analysis detailing your home's value as well as a comparison with similar homes in the area
Home Values in the Area
Average Home Value in this Area
Purchase History
| Date | Buyer | Sale Price | Title Company |
|---|---|---|---|
| Singh Sukhjinder | $285,000 | -- | |
| Singh Jasvir | $102,000 | -- | |
| Singh Jaevir | $102,000 | -- |
Source: Public Records
Mortgage History
| Date | Status | Borrower | Loan Amount |
|---|---|---|---|
| Previous Owner | Singh Sukhjinder | $185,250 | |
| Previous Owner | Singh Jaevir | $60,000 |
Source: Public Records
Tax History Compared to Growth
Tax History
| Year | Tax Paid | Tax Assessment Tax Assessment Total Assessment is a certain percentage of the fair market value that is determined by local assessors to be the total taxable value of land and additions on the property. | Land | Improvement |
|---|---|---|---|---|
| 2025 | $10,001 | $575,300 | $320,000 | $255,300 |
| 2024 | $9,744 | $313,700 | $95,000 | $218,700 |
| 2023 | $9,744 | $313,700 | $95,000 | $218,700 |
| 2022 | $9,474 | $313,700 | $95,000 | $218,700 |
| 2021 | $6,942 | $313,700 | $95,000 | $218,700 |
| 2020 | $9,022 | $313,700 | $95,000 | $218,700 |
| 2019 | $8,762 | $313,700 | $95,000 | $218,700 |
| 2018 | $8,555 | $313,700 | $95,000 | $218,700 |
| 2017 | $8,250 | $313,700 | $95,000 | $218,700 |
| 2016 | $9,264 | $287,000 | $75,000 | $212,000 |
| 2015 | $8,957 | $287,000 | $75,000 | $212,000 |
| 2014 | $8,567 | $287,000 | $75,000 | $212,000 |
Source: Public Records
Map
Nearby Homes
- 3 State St
- 26 Fillmore Ave
- 6 Elmwood Ave
- 34 Taylor Ave
- 73 Edgar St
- 123 Heald St
- 85 Whitman St
- 56 Thornal St
- 165 Randolph St
- 29 Swarthmore Dr
- 779 Roosevelt Ave
- 7 Sunnyside Dr
- 245 Carteret Ave
- 23 Leick Ave
- 114 Daniel St
- 22 N Whittier St Unit B
- 98 Wortylko St
- 140 Whitman St
- 89 Tennyson St
- 117 Hagaman St