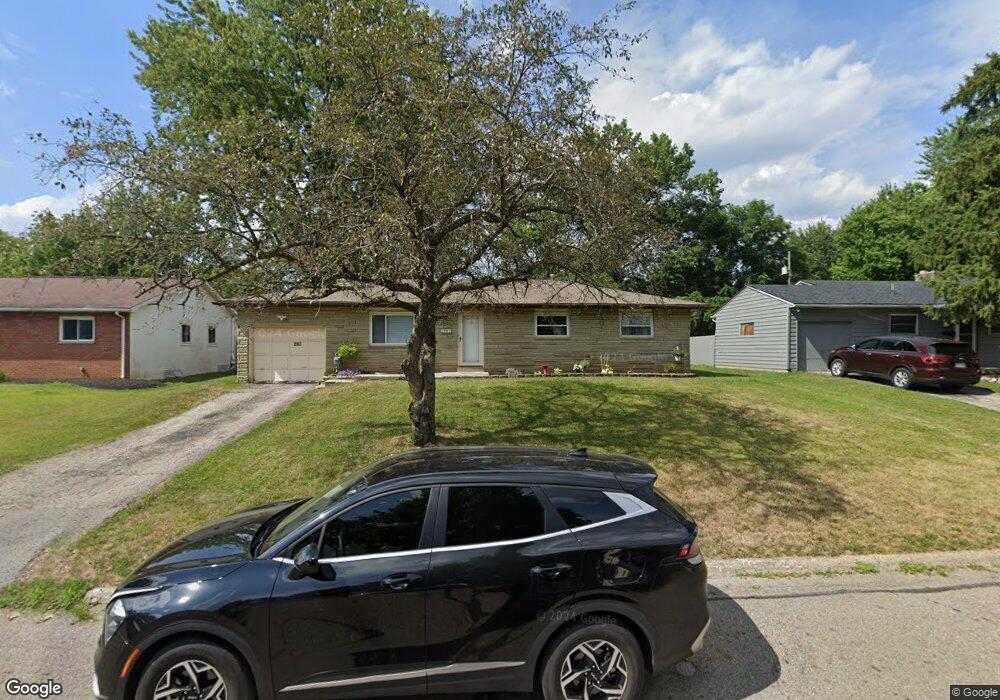
290 Rocky Fork Dr N Columbus, OH 43230
Gahanna-Havens Corners NeighborhoodEstimated Value: $303,144 - $332,000
3
Beds
2
Baths
1,232
Sq Ft
$257/Sq Ft
Est. Value
About This Home
This home is located at 290 Rocky Fork Dr N, Columbus, OH 43230 and is currently estimated at $316,286, approximately $256 per square foot. 290 Rocky Fork Dr N is a home located in Franklin County with nearby schools including Goshen Lane Elementary School, Gahanna East Middle School, and Lincoln High School.
Ownership History
Date
Name
Owned For
Owner Type
Purchase Details
Closed on
Dec 10, 2020
Sold by
Burris Newton L and Burris Newton
Bought by
Park Place Capital Llc
Current Estimated Value
Purchase Details
Closed on
Oct 2, 2009
Sold by
Burris Katina M and Burris Newton L
Bought by
Burris Newton L
Purchase Details
Closed on
Mar 26, 2004
Sold by
Parham Juandell
Bought by
Burris Newton L and Burris Katina M
Home Financials for this Owner
Home Financials are based on the most recent Mortgage that was taken out on this home.
Original Mortgage
$99,750
Interest Rate
5.65%
Mortgage Type
Purchase Money Mortgage
Purchase Details
Closed on
Nov 30, 1999
Sold by
Dunn Donald G
Bought by
Parham Juandell
Home Financials for this Owner
Home Financials are based on the most recent Mortgage that was taken out on this home.
Original Mortgage
$113,807
Interest Rate
7.87%
Mortgage Type
FHA
Purchase Details
Closed on
Nov 29, 1993
Purchase Details
Closed on
Nov 1, 1984
Create a Home Valuation Report for This Property
The Home Valuation Report is an in-depth analysis detailing your home's value as well as a comparison with similar homes in the area
Home Values in the Area
Average Home Value in this Area
Purchase History
| Date | Buyer | Sale Price | Title Company |
|---|---|---|---|
| Park Place Capital Llc | -- | None Available | |
| Burris Newton L | -- | None Available | |
| Burris Newton L | $105,000 | Valmer Land Title Agency | |
| Parham Juandell | $115,000 | Lawyers Title | |
| -- | $85,300 | -- | |
| -- | $60,000 | -- |
Source: Public Records
Mortgage History
| Date | Status | Borrower | Loan Amount |
|---|---|---|---|
| Previous Owner | Burris Newton L | $99,750 | |
| Previous Owner | Parham Juandell | $113,807 |
Source: Public Records
Tax History Compared to Growth
Tax History
| Year | Tax Paid | Tax Assessment Tax Assessment Total Assessment is a certain percentage of the fair market value that is determined by local assessors to be the total taxable value of land and additions on the property. | Land | Improvement |
|---|---|---|---|---|
| 2024 | $5,165 | $85,930 | $24,500 | $61,430 |
| 2023 | $5,101 | $85,925 | $24,500 | $61,425 |
| 2022 | $4,177 | $54,810 | $11,200 | $43,610 |
| 2021 | $4,043 | $54,810 | $11,200 | $43,610 |
| 2020 | $4,011 | $54,810 | $11,200 | $43,610 |
| 2019 | $3,394 | $46,140 | $9,350 | $36,790 |
| 2018 | $3,541 | $46,140 | $9,350 | $36,790 |
| 2017 | $3,123 | $46,140 | $9,350 | $36,790 |
| 2016 | $3,708 | $49,880 | $13,860 | $36,020 |
| 2015 | $3,711 | $49,880 | $13,860 | $36,020 |
| 2014 | $3,682 | $49,880 | $13,860 | $36,020 |
| 2013 | $1,806 | $49,210 | $13,195 | $36,015 |
Source: Public Records
Map
Nearby Homes
- 183 Serran Dr
- 198 Gary Lee Dr
- 219 N Hamilton Rd
- 206 Lintner St
- 379 Heil Dr
- 311 N Hamilton Rd
- 745 Fleetrun Ave
- 714 Schyler Ct
- 373 Lyncroft Dr
- 610 Chadwood Dr
- 390 Dunbarton Rd
- 407 Denison Ave
- 536 Tresham Rd
- 209 Springbrook Place
- 317 Sycamore Ridge Way Unit 317
- 236 Winfall Dr
- 497 Uxbridge Ave
- 657 Picadilly Ct
- 174 Grand Ridge Ct
- 175 Stonegate Cir
- 290 Rocky Fork Dr
- 290 Rocky Fork Dr
- 284 Rocky Fork Dr N
- 298 Rocky Fork Dr N
- 293 Gary Lee Dr
- 304 Rocky Fork Dr N
- 276 Rocky Fork Dr N
- 301 Gary Lee Dr
- 285 Gary Lee Dr
- 289 Rocky Fork Dr N
- 307 Gary Lee Dr
- 283 Rocky Fork Dr N
- 297 Rocky Fork Dr N
- 279 Gary Lee Dr
- 312 Rocky Fork Dr N
- 270 Rocky Fork Dr N
- 315 Gary Lee Dr
- 273 Rocky Fork Dr N
- 273 Gary Lee Dr
- 311 Rocky Fork Dr N