Estimated Value: $291,000 - $344,000
3
Beds
1
Bath
1,139
Sq Ft
$283/Sq Ft
Est. Value
About This Home
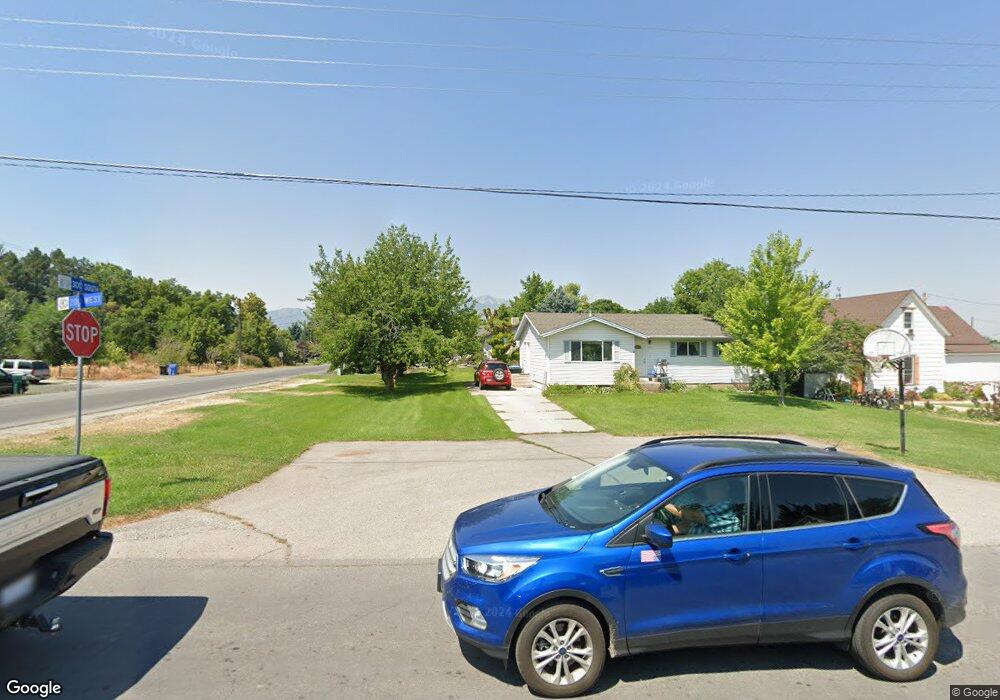
This home is located at 290 S 200 W, Hyrum, UT 84319 and is currently estimated at $322,293, approximately $282 per square foot. 290 S 200 W is a home located in Cache County with nearby schools including Lincoln School, South Cache Middle School, and Mountain Crest High School.
Ownership History
Date
Name
Owned For
Owner Type
Purchase Details
Closed on
Oct 16, 2013
Sold by
Bates Kendal Donn and Bates Sharlee O
Bought by
Brower Owen James and Brower Myrla T
Current Estimated Value
Purchase Details
Closed on
Aug 20, 2002
Sold by
Fifth Third Investment Company
Bought by
Curtis Rand and Curtis Leslie
Purchase Details
Closed on
May 16, 2002
Sold by
Watkins Jonathan D and Watkins Kristine M
Bought by
Fifth Third Investment Company
Purchase Details
Closed on
Feb 1, 2001
Sold by
Baer Jeremy T and Baer Natalie J
Bought by
Watkins Jonathan D and Watkins Kristine M
Home Financials for this Owner
Home Financials are based on the most recent Mortgage that was taken out on this home.
Original Mortgage
$99,800
Interest Rate
7.13%
Mortgage Type
FHA
Create a Home Valuation Report for This Property
The Home Valuation Report is an in-depth analysis detailing your home's value as well as a comparison with similar homes in the area
Home Values in the Area
Average Home Value in this Area
Purchase History
| Date | Buyer | Sale Price | Title Company |
|---|---|---|---|
| Brower Owen James | -- | Cache Title Logan | |
| Curtis Rand | -- | American Secure Title | |
| Fifth Third Investment Company | $69,500 | Backman Stewart Title Svcs | |
| Watkins Jonathan D | -- | Northern Title Company |
Source: Public Records
Mortgage History
| Date | Status | Borrower | Loan Amount |
|---|---|---|---|
| Previous Owner | Watkins Jonathan D | $99,800 |
Source: Public Records
Tax History Compared to Growth
Tax History
| Year | Tax Paid | Tax Assessment Tax Assessment Total Assessment is a certain percentage of the fair market value that is determined by local assessors to be the total taxable value of land and additions on the property. | Land | Improvement |
|---|---|---|---|---|
| 2024 | $1,150 | $154,180 | $0 | $0 |
| 2023 | $1,080 | $138,485 | $0 | $0 |
| 2022 | $1,127 | $138,480 | $0 | $0 |
| 2021 | $1,102 | $208,690 | $65,050 | $143,640 |
| 2020 | $1,040 | $184,750 | $65,050 | $119,700 |
| 2019 | $864 | $144,274 | $40,000 | $104,274 |
| 2018 | $795 | $128,368 | $40,000 | $88,368 |
| 2017 | $780 | $65,395 | $0 | $0 |
| 2016 | $798 | $65,395 | $0 | $0 |
| 2015 | $800 | $65,395 | $0 | $0 |
| 2014 | $769 | $64,265 | $0 | $0 |
| 2013 | -- | $64,265 | $0 | $0 |
Source: Public Records
Map
Nearby Homes