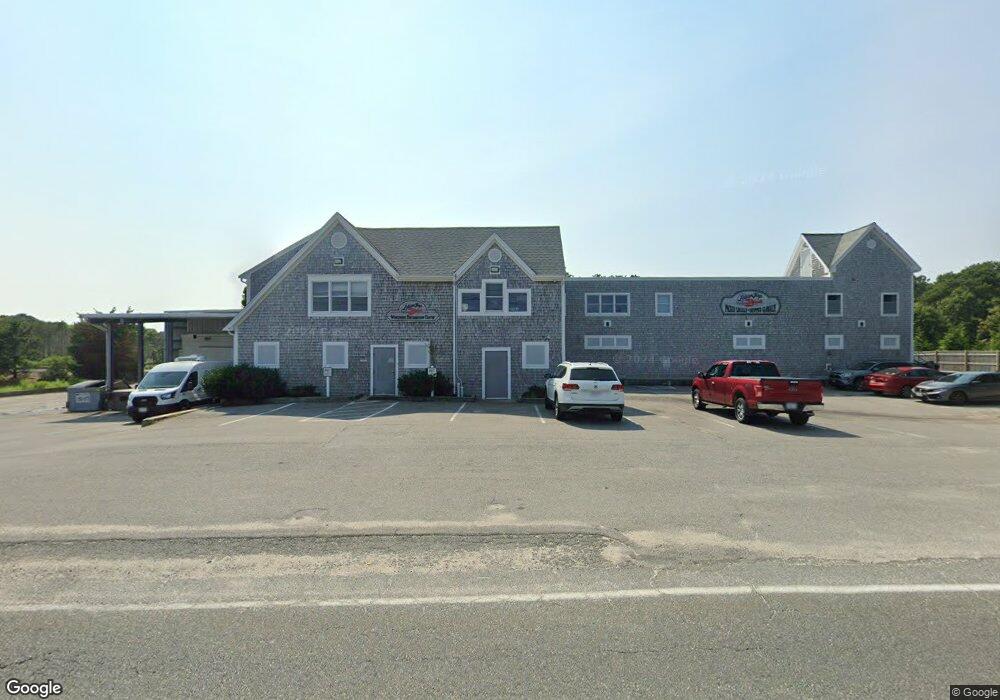
290 Shore Rd Bourne, MA 2532
Monument Beach NeighborhoodEstimated Value: $4,826,004
Studio
--
Bath
10,443
Sq Ft
$462/Sq Ft
Est. Value
About This Home
This home is located at 290 Shore Rd, Bourne, MA 2532 and is currently estimated at $4,826,004, approximately $462 per square foot. 290 Shore Rd is a home located in Barnstable County with nearby schools including Bourne High School, Cadence Academy Preschool - Bourne, and St Margaret Regional School.
Ownership History
Date
Name
Owned For
Owner Type
Purchase Details
Closed on
Jul 8, 2022
Sold by
Lobster Trap Co Inc
Bought by
Mslt Bourne Llc
Current Estimated Value
Home Financials for this Owner
Home Financials are based on the most recent Mortgage that was taken out on this home.
Original Mortgage
$2,187,500
Outstanding Balance
$2,075,262
Interest Rate
5.1%
Mortgage Type
Purchase Money Mortgage
Estimated Equity
$2,750,742
Purchase Details
Closed on
Mar 31, 1978
Bought by
Lobster Trap Co Inc
Create a Home Valuation Report for This Property
The Home Valuation Report is an in-depth analysis detailing your home's value as well as a comparison with similar homes in the area
Home Values in the Area
Average Home Value in this Area
Purchase History
| Date | Buyer | Sale Price | Title Company |
|---|---|---|---|
| Mslt Bourne Llc | $4,375,000 | None Available | |
| Mslt Bourne Llc | $4,375,000 | None Available | |
| Lobster Trap Co Inc | -- | -- |
Source: Public Records
Mortgage History
| Date | Status | Borrower | Loan Amount |
|---|---|---|---|
| Open | Mslt Bourne Llc | $2,187,500 | |
| Closed | Mslt Bourne Llc | $2,187,500 | |
| Previous Owner | Lobster Trap Co Inc | $0 | |
| Previous Owner | Lobster Trap Co Inc | $750,000,000 | |
| Previous Owner | Lobster Trap Co Inc | $1,000,000 |
Source: Public Records
Tax History
| Year | Tax Paid | Tax Assessment Tax Assessment Total Assessment is a certain percentage of the fair market value that is determined by local assessors to be the total taxable value of land and additions on the property. | Land | Improvement |
|---|---|---|---|---|
| 2025 | $32,082 | $4,107,800 | $539,600 | $3,568,200 |
| 2024 | $28,287 | $3,527,100 | $513,900 | $3,013,200 |
| 2023 | $10,458 | $1,187,100 | $494,200 | $692,900 |
| 2022 | $10,964 | $1,086,600 | $464,600 | $622,000 |
| 2021 | $11,360 | $1,054,800 | $451,100 | $603,700 |
| 2020 | $11,191 | $1,042,000 | $442,300 | $599,700 |
| 2019 | $10,743 | $1,022,200 | $433,600 | $588,600 |
| 2018 | $10,402 | $986,900 | $416,900 | $570,000 |
| 2017 | $10,091 | $979,700 | $412,700 | $567,000 |
| 2016 | $10,004 | $984,600 | $412,700 | $571,900 |
Source: Public Records
Map
Nearby Homes
- 14 Navajo Rd
- 254 Barlows Landing Rd
- 16 Michael Rd
- 566 Shore Rd
- 551 Shore Rd
- 174 Barlows Landing Rd
- 14 Virginia Rd
- 8 Elizabeth Rd
- 6 Andrea Rd
- 3 1st St
- 3 4th Ave
- 7 4th Ave
- 10 Howard Ave
- 10 Howard Ave
- 21 Club House Dr
- 23 Club House Dr
- 47 Cliff Rd
- 1 Hawthorne Ct Unit C
- 135 Leeward Rd
- 77 Roundhouse Rd Unit 77
Your Personal Tour Guide
Ask me questions while you tour the home.