Estimated Value: $792,000 - $944,000
4
Beds
4
Baths
5,872
Sq Ft
$151/Sq Ft
Est. Value
About This Home
This home is located at 290 Stratford Ln, Xenia, OH 45385 and is currently estimated at $886,830, approximately $151 per square foot. 290 Stratford Ln is a home located in Greene County with nearby schools including Trebein Elementary School, Jacob Coy Middle School, and Beavercreek High School.
Ownership History
Date
Name
Owned For
Owner Type
Purchase Details
Closed on
Jun 30, 2021
Sold by
Morgan Kenneth J and Morgan Tracy A
Bought by
Bogle Andrew Eric and Bogle Erica
Current Estimated Value
Home Financials for this Owner
Home Financials are based on the most recent Mortgage that was taken out on this home.
Original Mortgage
$436,000
Outstanding Balance
$395,602
Interest Rate
2.9%
Mortgage Type
New Conventional
Estimated Equity
$491,228
Purchase Details
Closed on
Nov 30, 2009
Sold by
Jackson Ronald P and Jackson Lisa M
Bought by
Moran Kenneth J and Moran Tracy A
Home Financials for this Owner
Home Financials are based on the most recent Mortgage that was taken out on this home.
Original Mortgage
$468,000
Interest Rate
5.05%
Mortgage Type
VA
Purchase Details
Closed on
Sep 18, 2003
Sold by
Brenner Holdings Llc
Bought by
Jackson Ronald P and Jackson Lisa M
Create a Home Valuation Report for This Property
The Home Valuation Report is an in-depth analysis detailing your home's value as well as a comparison with similar homes in the area
Home Values in the Area
Average Home Value in this Area
Purchase History
| Date | Buyer | Sale Price | Title Company |
|---|---|---|---|
| Bogle Andrew Eric | $736,000 | None Available | |
| Moran Kenneth J | $520,000 | None Available | |
| Jackson Ronald P | $114,000 | -- |
Source: Public Records
Mortgage History
| Date | Status | Borrower | Loan Amount |
|---|---|---|---|
| Open | Bogle Andrew Eric | $436,000 | |
| Closed | Moran Kenneth J | $468,000 |
Source: Public Records
Tax History Compared to Growth
Tax History
| Year | Tax Paid | Tax Assessment Tax Assessment Total Assessment is a certain percentage of the fair market value that is determined by local assessors to be the total taxable value of land and additions on the property. | Land | Improvement |
|---|---|---|---|---|
| 2024 | $14,489 | $252,280 | $19,870 | $232,410 |
| 2023 | $14,489 | $252,280 | $19,870 | $232,410 |
| 2022 | $14,292 | $218,180 | $19,870 | $198,310 |
| 2021 | $12,821 | $193,800 | $19,870 | $173,930 |
| 2020 | $12,883 | $193,800 | $19,870 | $173,930 |
| 2019 | $13,913 | $192,220 | $25,900 | $166,320 |
| 2018 | $12,165 | $192,310 | $25,900 | $166,410 |
| 2017 | $11,944 | $192,310 | $25,900 | $166,410 |
| 2016 | $11,646 | $181,470 | $25,900 | $155,570 |
| 2015 | $11,719 | $181,470 | $25,900 | $155,570 |
| 2014 | $11,454 | $181,470 | $25,900 | $155,570 |
Source: Public Records
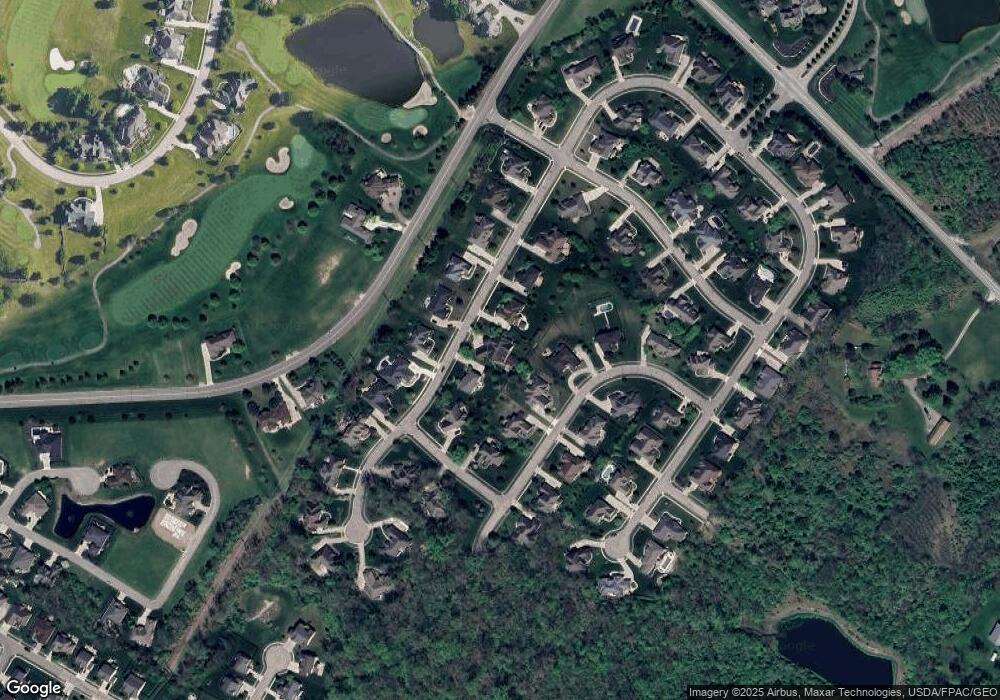
Map
Nearby Homes
- 295 Stratford Ln
- 2436 Sherbourne Way
- 463 Valhalla Ct
- 139 Signature Dr S
- 2353 Sherwood Ct
- 2284 Annandale Place
- 2178 Annandale Place
- 29 Governors Club Dr
- 33 Governors Club Dr
- Congressional Plan at Country Club of the North - Luxury Series
- Somerset Plan at Country Club of the North - Signature Series
- Addington Plan at Country Club of the North - Luxury Series
- Heatherwood Plan at Country Club of the North - Signature Series
- Savannah Plan at Country Club of the North - Luxury Series
- Crooked Stick Plan at Country Club of the North - Signature Series
- Breton Plan at Country Club of the North - Luxury Series
- Oakmont Plan at Country Club of the North - Signature Series
- Arcadia Plan at Country Club of the North - Luxury Series
- Shadow Creek Plan at Country Club of the North - Signature Series
- Rubicon Plan at Country Club of the North - Signature Series
- 290 Stratford Ln
- 280 Stratford Ln
- 305 Hampton Place
- 295 Hampton Place
- 285 Stratford Ln
- 270 Stratford Ln
- 315 Hampton Place
- 2360 Wellington Ln
- 275 Stratford Ln
- 305 Stratford Ln
- 2348 Wellington Ln
- 265 Stratford Ln
- 289 Hampton Place
- 260 Stratford Ln
- 315 Stratford Ln
- 312 Hampton Place
- 292 Hampton Place
- 314 Hampton Place
- 255 Stratford Ln
- 330 Stratford Ln