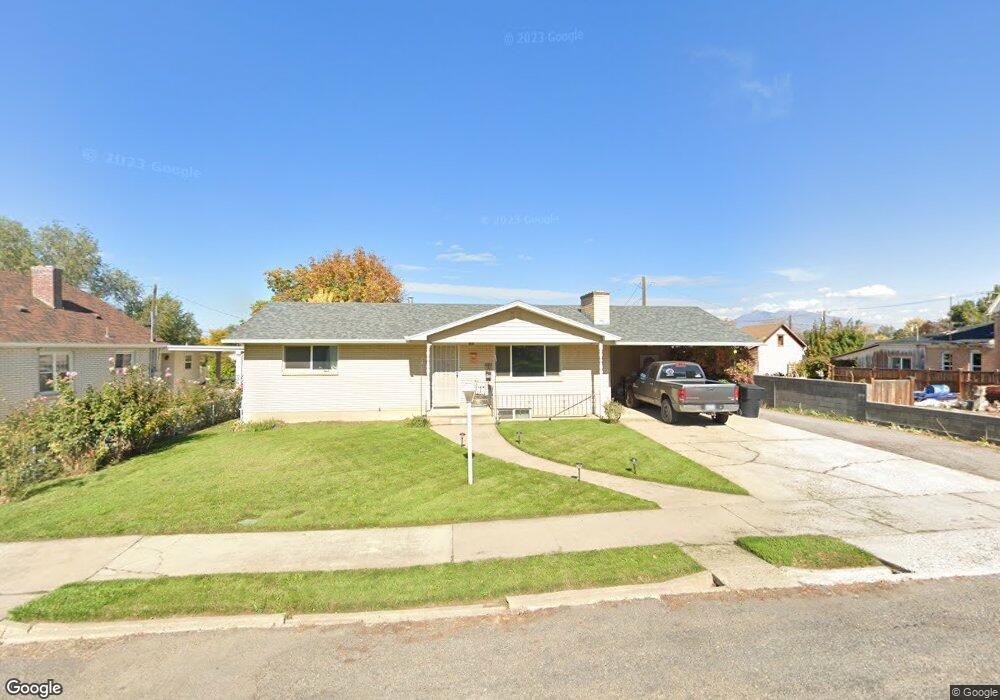
290 W 100 N Payson, UT 84651
Estimated Value: $446,000 - $502,246
4
Beds
2
Baths
2,712
Sq Ft
$176/Sq Ft
Est. Value
About This Home
This home is located at 290 W 100 N, Payson, UT 84651 and is currently estimated at $476,562, approximately $175 per square foot. 290 W 100 N is a home located in Utah County with nearby schools including Taylor Elementary School, Mt. Nebo Junior High School, and Salem Junior High School.
Ownership History
Date
Name
Owned For
Owner Type
Purchase Details
Closed on
Aug 7, 2015
Sold by
Jasperson Andrew and The Clyde S Jasperson And Lorn
Bought by
Schuster Jerem
Current Estimated Value
Purchase Details
Closed on
Jan 18, 1997
Sold by
Jasperson Clyde S and Jasperson Lorna J
Bought by
Clyde S & Lorna Jean Jasperson Family Tr
Create a Home Valuation Report for This Property
The Home Valuation Report is an in-depth analysis detailing your home's value as well as a comparison with similar homes in the area
Home Values in the Area
Average Home Value in this Area
Purchase History
| Date | Buyer | Sale Price | Title Company |
|---|---|---|---|
| Schuster Jerem | -- | Highland Title | |
| Clyde S & Lorna Jean Jasperson Family Tr | -- | -- |
Source: Public Records
Tax History Compared to Growth
Tax History
| Year | Tax Paid | Tax Assessment Tax Assessment Total Assessment is a certain percentage of the fair market value that is determined by local assessors to be the total taxable value of land and additions on the property. | Land | Improvement |
|---|---|---|---|---|
| 2025 | $2,337 | $253,275 | $139,400 | $321,100 |
| 2024 | $2,337 | $237,820 | $0 | $0 |
| 2023 | $2,314 | $236,170 | $0 | $0 |
| 2022 | $2,146 | $215,380 | $0 | $0 |
| 2021 | $1,827 | $294,200 | $91,500 | $202,700 |
| 2020 | $1,699 | $267,600 | $79,600 | $188,000 |
| 2019 | $1,492 | $240,900 | $71,700 | $169,200 |
| 2018 | $1,334 | $207,600 | $60,500 | $147,100 |
| 2017 | $1,236 | $103,455 | $0 | $0 |
| 2016 | $1,206 | $100,320 | $0 | $0 |
Source: Public Records
Map
Nearby Homes
- 84 W 400 N
- 197 E Utah Ave
- 116 E 100 S
- 115 N 300 E
- 244 E 300 N
- 1323 N 1390 E Unit 26-101
- 387 N 300 E
- 395 N 600 W
- 735 W 100 S
- 607 N 125 W
- 1836 S 100 E Unit 2
- 383 W 625 N Unit A-D
- 384 W 650 N Unit A-D
- 361 W 625 N Unit A-D
- 370 E 300 S
- 443 E 450 N
- 548 E 200 N
- 446 N 460 E Unit 9
- 468 N 460 E Unit LOT 7
- 135 E 500 S