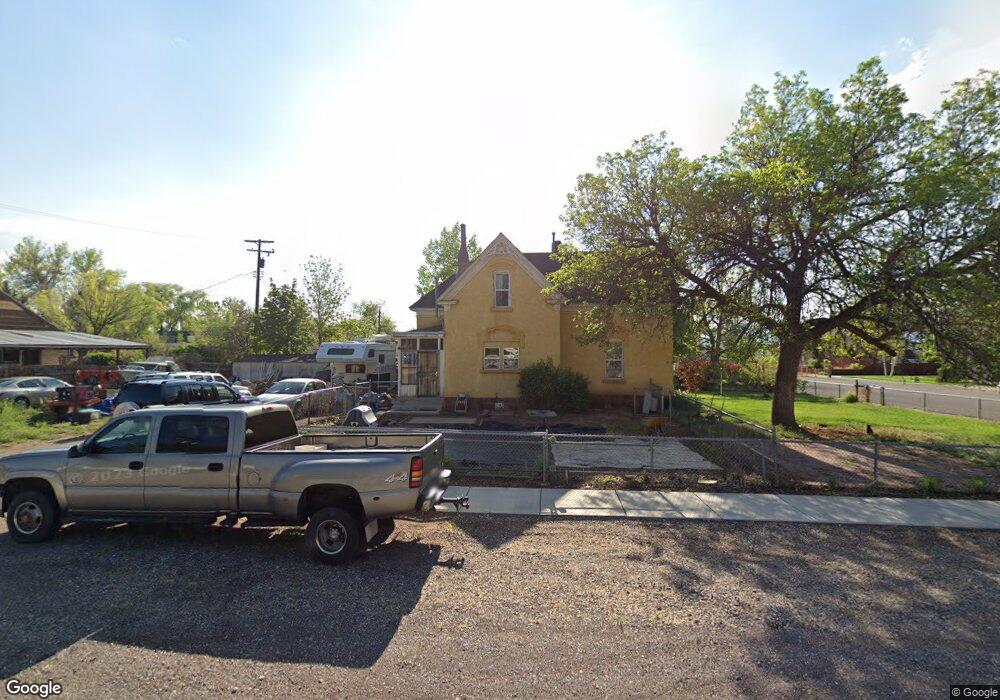
290 W 100 N Richfield, UT 84701
Estimated Value: $295,000 - $342,000
4
Beds
2
Baths
2,630
Sq Ft
$121/Sq Ft
Est. Value
About This Home
This home is located at 290 W 100 N, Richfield, UT 84701 and is currently estimated at $317,216, approximately $120 per square foot. 290 W 100 N is a home located in Sevier County with nearby schools including Ashman School, Pahvant School, and Red Hills Middle School.
Ownership History
Date
Name
Owned For
Owner Type
Purchase Details
Closed on
Mar 2, 2016
Sold by
Neilson Kay Elaine
Bought by
Adams Thomas and Adams Marlo R
Current Estimated Value
Home Financials for this Owner
Home Financials are based on the most recent Mortgage that was taken out on this home.
Original Mortgage
$81,720
Interest Rate
3.71%
Mortgage Type
VA
Purchase Details
Closed on
Sep 20, 2011
Sold by
Christensen Lance W and Christensen Kelley Ann
Bought by
Neilson Kay Elaine and The Kay Elaine Neilson Family Trust
Purchase Details
Closed on
Sep 24, 2010
Sold by
Neilson Kay Elaine
Bought by
Christensen Lance W and Christensen Kelley Ann
Home Financials for this Owner
Home Financials are based on the most recent Mortgage that was taken out on this home.
Original Mortgage
$160,000
Interest Rate
4.38%
Mortgage Type
Seller Take Back
Create a Home Valuation Report for This Property
The Home Valuation Report is an in-depth analysis detailing your home's value as well as a comparison with similar homes in the area
Home Values in the Area
Average Home Value in this Area
Purchase History
| Date | Buyer | Sale Price | Title Company |
|---|---|---|---|
| Adams Thomas | -- | Utah Title | |
| Neilson Kay Elaine | $168,444 | -- | |
| Christensen Lance W | -- | -- |
Source: Public Records
Mortgage History
| Date | Status | Borrower | Loan Amount |
|---|---|---|---|
| Previous Owner | Adams Thomas | $81,720 | |
| Previous Owner | Christensen Lance W | $160,000 |
Source: Public Records
Tax History Compared to Growth
Tax History
| Year | Tax Paid | Tax Assessment Tax Assessment Total Assessment is a certain percentage of the fair market value that is determined by local assessors to be the total taxable value of land and additions on the property. | Land | Improvement |
|---|---|---|---|---|
| 2024 | $1,457 | $147,211 | $33,943 | $113,268 |
| 2023 | $1,457 | $160,110 | $31,228 | $128,882 |
| 2022 | $1,470 | $134,261 | $26,638 | $107,623 |
| 2021 | $1,346 | $103,471 | $27,397 | $76,074 |
| 2020 | $1,269 | $94,802 | $19,246 | $75,556 |
| 2019 | $1,079 | $85,330 | $16,040 | $69,290 |
| 2018 | $1,116 | $79,060 | $16,040 | $63,020 |
| 2017 | $1,085 | $73,410 | $16,040 | $57,370 |
| 2016 | $796 | $73,410 | $0 | $0 |
| 2015 | $796 | $72,420 | $0 | $0 |
| 2014 | $796 | $69,190 | $0 | $0 |
Source: Public Records
Map
Nearby Homes