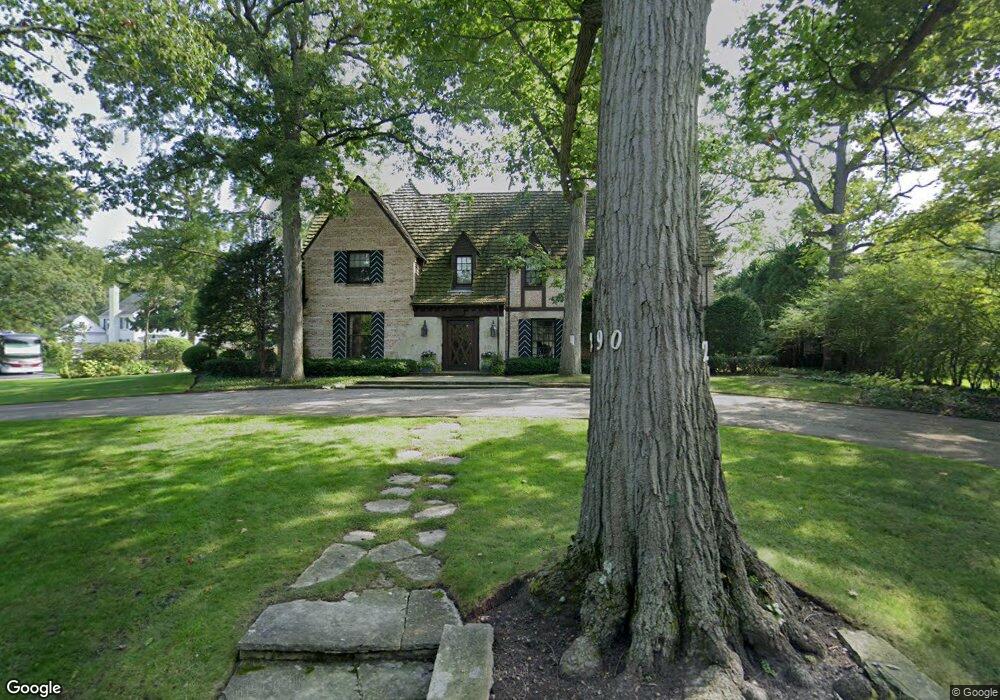
290 Woodland Rd Highland Park, IL 60035
East Highland Park NeighborhoodEstimated Value: $1,495,000 - $1,751,000
--
Bed
7
Baths
5,712
Sq Ft
$292/Sq Ft
Est. Value
About This Home
This home is located at 290 Woodland Rd, Highland Park, IL 60035 and is currently estimated at $1,670,168, approximately $292 per square foot. 290 Woodland Rd is a home located in Lake County with nearby schools including Ravinia Elementary School, Edgewood Middle School, and Highland Park High School.
Ownership History
Date
Name
Owned For
Owner Type
Purchase Details
Closed on
Apr 26, 2011
Sold by
Kreiter Plotkin Jonathan and Kreiter Plotkin Robin
Bought by
Revocabl Plotkin Robin and Revocabl Robin Kreiter Plotkin
Current Estimated Value
Purchase Details
Closed on
Dec 19, 2003
Sold by
Plotkin Robin Kreiter
Bought by
Kreiter Plotkin Jonathan and Kreiter Plotkin Robin
Home Financials for this Owner
Home Financials are based on the most recent Mortgage that was taken out on this home.
Original Mortgage
$333,700
Interest Rate
5.91%
Mortgage Type
New Conventional
Purchase Details
Closed on
Sep 7, 1994
Sold by
Kreiter Plotkin Jonathan Dean and Kreiter Plotkin Robin
Bought by
Plotkin Robin Kreiter
Purchase Details
Closed on
Feb 28, 1994
Sold by
Bakalar John S and Bakalar Christine H
Bought by
Kreiter Plotkin Jonathan Dean and Kreiter Plotkin Robin
Home Financials for this Owner
Home Financials are based on the most recent Mortgage that was taken out on this home.
Original Mortgage
$500,000
Interest Rate
7.04%
Create a Home Valuation Report for This Property
The Home Valuation Report is an in-depth analysis detailing your home's value as well as a comparison with similar homes in the area
Home Values in the Area
Average Home Value in this Area
Purchase History
| Date | Buyer | Sale Price | Title Company |
|---|---|---|---|
| Revocabl Plotkin Robin | -- | None Available | |
| Kreiter Plotkin Jonathan | -- | Chicago Title Insurance Comp | |
| Plotkin Robin Kreiter | -- | -- | |
| Kreiter Plotkin Jonathan Dean | $766,666 | -- |
Source: Public Records
Mortgage History
| Date | Status | Borrower | Loan Amount |
|---|---|---|---|
| Previous Owner | Kreiter Plotkin Jonathan | $333,700 | |
| Previous Owner | Kreiter Plotkin Jonathan Dean | $500,000 |
Source: Public Records
Tax History Compared to Growth
Tax History
| Year | Tax Paid | Tax Assessment Tax Assessment Total Assessment is a certain percentage of the fair market value that is determined by local assessors to be the total taxable value of land and additions on the property. | Land | Improvement |
|---|---|---|---|---|
| 2024 | $31,411 | $406,109 | $152,591 | $253,518 |
| 2023 | $33,549 | $366,062 | $137,544 | $228,518 |
| 2022 | $33,549 | $378,550 | $151,099 | $227,451 |
| 2021 | $30,936 | $365,926 | $146,060 | $219,866 |
| 2020 | $29,935 | $365,926 | $146,060 | $219,866 |
| 2019 | $28,924 | $364,214 | $145,377 | $218,837 |
| 2018 | $16,560 | $397,946 | $161,981 | $235,965 |
| 2017 | $29,396 | $395,651 | $161,047 | $234,604 |
| 2016 | $28,354 | $376,667 | $153,320 | $223,347 |
| 2015 | $27,500 | $391,893 | $142,451 | $249,442 |
| 2014 | $30,556 | $379,165 | $139,403 | $239,762 |
| 2012 | $29,705 | $381,377 | $140,216 | $241,161 |
Source: Public Records
Map
Nearby Homes
- 378 Oakland Dr
- 625 Sheridan Rd
- 732 Bronson Ln
- 325 Lincolnwood Rd
- 590 Melody Ln
- 855 Sheridan Rd
- 298 Leslee Ln
- 590 Rambler Ln
- 600 Broadview Ave
- 566 Bellevue Place
- 721 Marion Ave
- 847 Marion Ave
- 32 Valley Rd
- 906 Pleasant Ave
- 860 Green Bay Rd
- 19 Heritage Dr
- 8 Heritage Dr
- 1330 Sheridan Rd
- 55 S Deere Park Dr
- 1200 Green Bay Rd
- 300 Woodland Rd
- 550 Groveland Ave
- 575 Groveland Ave
- 258 Woodland Rd
- 320 Woodland Rd
- 561 Groveland Ave
- 295 Woodland Rd
- 281 Woodland Rd
- 265 Woodland Rd
- 261 Woodland Rd
- 305 Woodland Rd
- 338 Woodland Rd
- 315 Oakland Dr
- 545 Groveland Ave
- 321 Woodland Rd
- 325 Oakland Dr
- 570 Lyman Ct
- 238 Woodland Rd
- 560 Lyman Ct
- 251 Woodland Rd