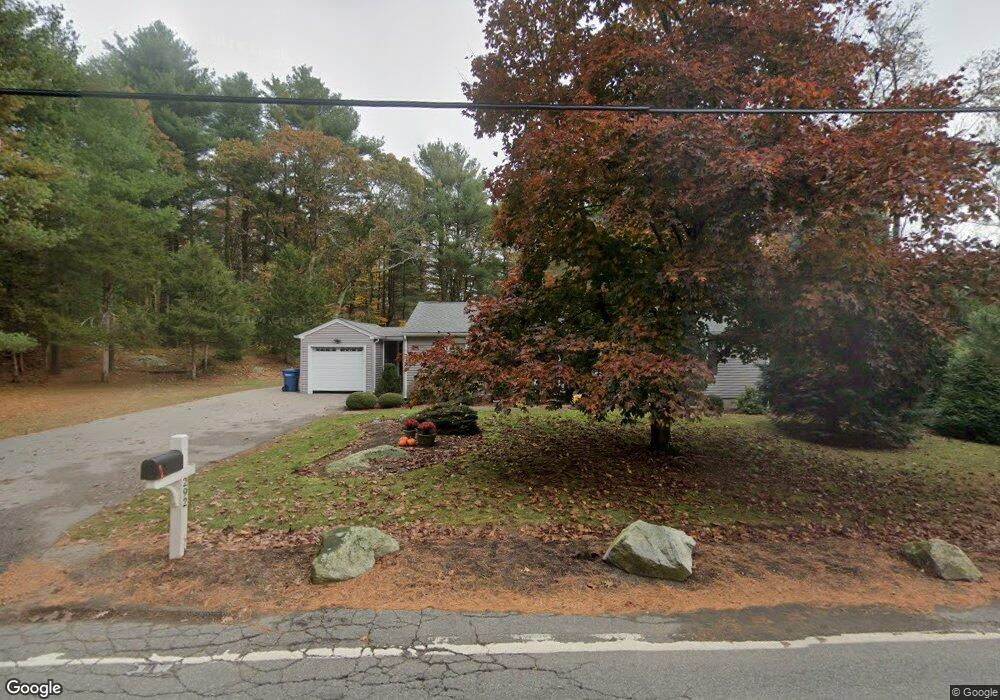
290 York St Canton, MA 02021
Estimated Value: $903,000 - $1,069,000
4
Beds
3
Baths
2,256
Sq Ft
$441/Sq Ft
Est. Value
About This Home
This home is located at 290 York St, Canton, MA 02021 and is currently estimated at $995,234, approximately $441 per square foot. 290 York St is a home located in Norfolk County with nearby schools including Canton High School.
Ownership History
Date
Name
Owned For
Owner Type
Purchase Details
Closed on
Dec 28, 2012
Sold by
Elms Michael R and Elms Dorothy E
Bought by
Michael R Elms Irt and Elms Michael R
Current Estimated Value
Purchase Details
Closed on
Feb 25, 2008
Sold by
Elms Dorothy E
Bought by
Elms Dorothy E and Elms Michael R
Home Financials for this Owner
Home Financials are based on the most recent Mortgage that was taken out on this home.
Original Mortgage
$95,000
Interest Rate
5.9%
Mortgage Type
Purchase Money Mortgage
Create a Home Valuation Report for This Property
The Home Valuation Report is an in-depth analysis detailing your home's value as well as a comparison with similar homes in the area
Home Values in the Area
Average Home Value in this Area
Purchase History
| Date | Buyer | Sale Price | Title Company |
|---|---|---|---|
| Michael R Elms Irt | -- | -- | |
| Michael R Elms Irt | -- | -- | |
| Elms Michael R | -- | -- | |
| Elms Dorothy E | -- | -- | |
| Elms Dorothy E | -- | -- | |
| Michael R Elms Irt | -- | -- | |
| Elms Dorothy E | -- | -- |
Source: Public Records
Mortgage History
| Date | Status | Borrower | Loan Amount |
|---|---|---|---|
| Previous Owner | Elms Dorothy E | $107,000 | |
| Previous Owner | Elms Dorothy E | $95,000 |
Source: Public Records
Tax History Compared to Growth
Tax History
| Year | Tax Paid | Tax Assessment Tax Assessment Total Assessment is a certain percentage of the fair market value that is determined by local assessors to be the total taxable value of land and additions on the property. | Land | Improvement |
|---|---|---|---|---|
| 2025 | $9,015 | $911,500 | $338,800 | $572,700 |
| 2024 | $8,742 | $876,800 | $325,800 | $551,000 |
| 2023 | $8,390 | $793,800 | $325,800 | $468,000 |
| 2022 | $8,417 | $741,600 | $310,200 | $431,400 |
| 2021 | $8,190 | $671,300 | $281,900 | $389,400 |
| 2020 | $7,824 | $639,700 | $268,500 | $371,200 |
| 2019 | $7,765 | $626,200 | $244,100 | $382,100 |
| 2018 | $7,483 | $602,500 | $234,800 | $367,700 |
| 2017 | $7,559 | $591,000 | $230,200 | $360,800 |
| 2016 | $7,431 | $581,000 | $224,500 | $356,500 |
| 2015 | $7,195 | $561,200 | $218,000 | $343,200 |
Source: Public Records
Map
Nearby Homes
- Lot 0 York St
- 11 Ledgewood Dr
- 3 Spotted Turtle Path Unit 24-2
- 16 Indian Ln
- 68 High St
- 14 Anderson Dr
- 50 Indian Ln
- 106 Indian Ln
- 902 Irving Rd Unit 902
- 133 Lafayette St
- 232 Canton St Unit 205
- 232 Canton St Unit 104
- 232 Canton St Unit 112
- 116 Indian Ln
- 36 Autumn Cir
- 19 Cynthia Rd
- 7 Kelly Way Unit 7
- 14 Iris Ct Unit 14
- 35 Blackman Rd
- 43 Ledgebrook Ave