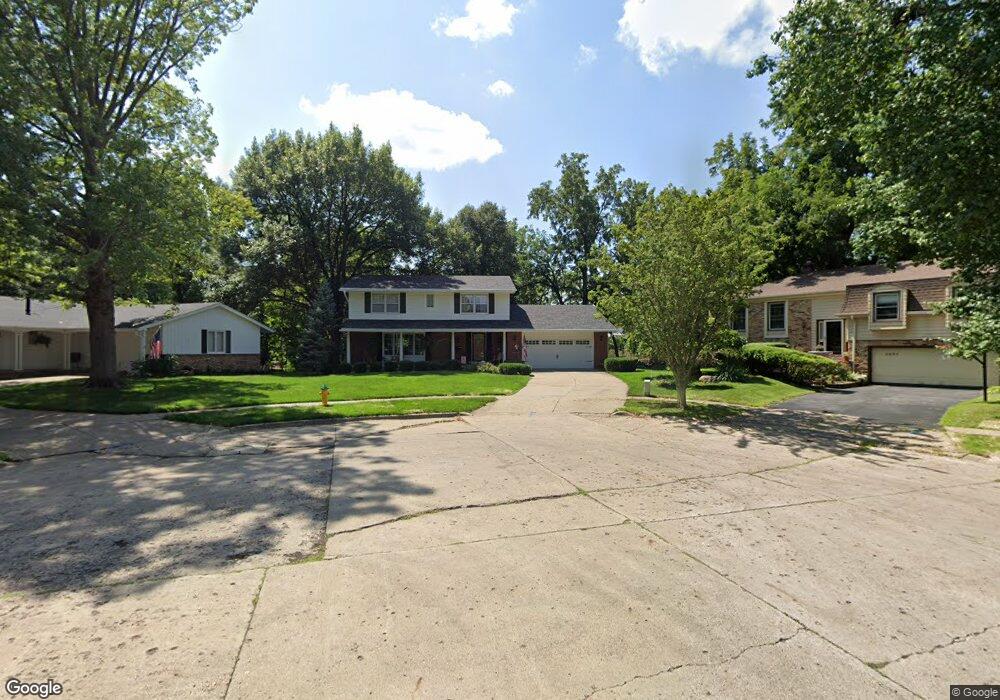
2900 37th St Des Moines, IA 50310
Beaverdale NeighborhoodEstimated Value: $365,000 - $429,000
4
Beds
3
Baths
2,081
Sq Ft
$186/Sq Ft
Est. Value
About This Home
This home is located at 2900 37th St, Des Moines, IA 50310 and is currently estimated at $386,744, approximately $185 per square foot. 2900 37th St is a home located in Polk County with nearby schools including Moore Elementary School, Meredith Middle School, and Hoover High School.
Ownership History
Date
Name
Owned For
Owner Type
Purchase Details
Closed on
May 10, 2010
Sold by
Phillips John C and Phillips Louise C
Bought by
Gookin Elizabeth
Current Estimated Value
Home Financials for this Owner
Home Financials are based on the most recent Mortgage that was taken out on this home.
Original Mortgage
$170,000
Interest Rate
5.12%
Mortgage Type
New Conventional
Purchase Details
Closed on
Nov 13, 2007
Sold by
Phillips John C and Louise Phillips C
Bought by
Phillips John C and Louise Phillips C
Create a Home Valuation Report for This Property
The Home Valuation Report is an in-depth analysis detailing your home's value as well as a comparison with similar homes in the area
Home Values in the Area
Average Home Value in this Area
Purchase History
| Date | Buyer | Sale Price | Title Company |
|---|---|---|---|
| Gookin Elizabeth | $226,500 | None Available | |
| Phillips John C | -- | None Available |
Source: Public Records
Mortgage History
| Date | Status | Borrower | Loan Amount |
|---|---|---|---|
| Closed | Gookin Elizabeth | $170,000 |
Source: Public Records
Tax History
| Year | Tax Paid | Tax Assessment Tax Assessment Total Assessment is a certain percentage of the fair market value that is determined by local assessors to be the total taxable value of land and additions on the property. | Land | Improvement |
|---|---|---|---|---|
| 2025 | $6,928 | $389,500 | $66,700 | $322,800 |
| 2024 | $6,928 | $352,200 | $59,300 | $292,900 |
| 2023 | $7,126 | $352,200 | $59,300 | $292,900 |
| 2022 | $7,072 | $302,400 | $52,300 | $250,100 |
| 2021 | $7,068 | $302,400 | $52,300 | $250,100 |
| 2020 | $7,342 | $283,200 | $48,900 | $234,300 |
| 2019 | $6,966 | $283,200 | $48,900 | $234,300 |
| 2018 | $6,896 | $259,200 | $43,300 | $215,900 |
| 2017 | $6,300 | $259,200 | $43,300 | $215,900 |
| 2016 | $6,138 | $232,900 | $38,400 | $194,500 |
| 2015 | $6,138 | $232,900 | $38,400 | $194,500 |
| 2014 | $5,980 | $225,100 | $36,400 | $188,700 |
Source: Public Records
Map
Nearby Homes
- 2824 35th St
- 2906 39th St
- 3501 Sheridan Ave
- 4011 Fagen Dr
- 4010 Sheridan Ave
- 3111 Leado Ave
- 4029 Ashby Ave
- 3124 Sheridan Ave
- 2513 33rd St
- 3112 Sheridan Ave
- 2412 33rd St
- 4142 Urbandale Ave
- 2415 Hickman Rd
- 3013 Sheridan Ave
- 3112 Beaver Ave
- 4200 New York Ave
- 2210 36th St
- 2208 38th St
- 2207 35th St
- 2615 30th St
Your Personal Tour Guide
Ask me questions while you tour the home.