2900 Aurora Ln Midland, TX 79707
Wedgewood Park NeighborhoodEstimated Value: $263,000 - $312,000
3
Beds
2
Baths
1,825
Sq Ft
$158/Sq Ft
Est. Value
About This Home
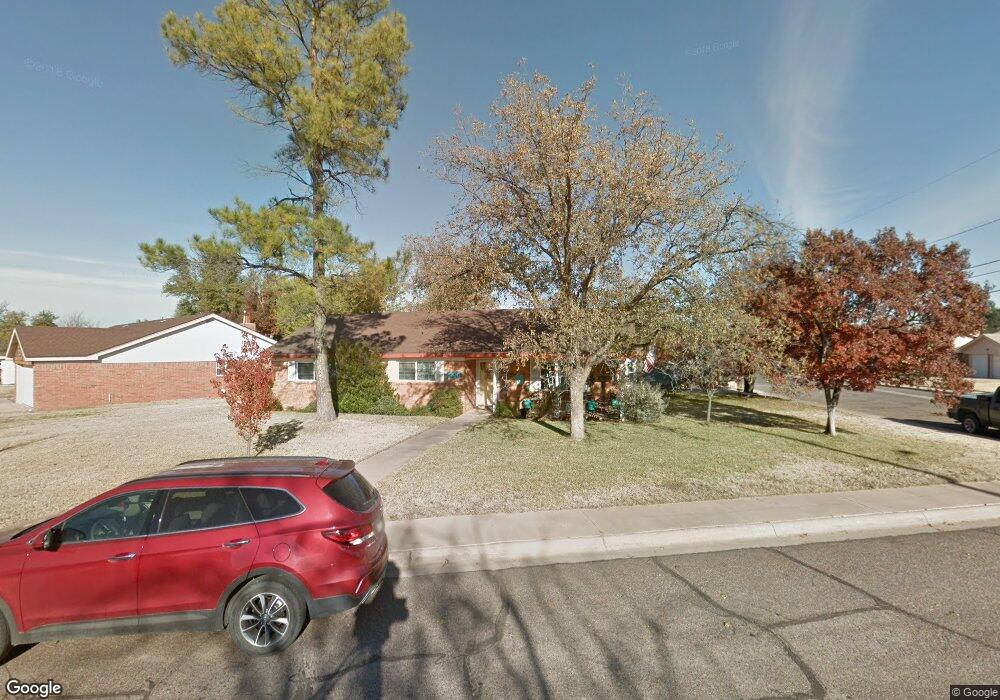
This home is located at 2900 Aurora Ln, Midland, TX 79707 and is currently estimated at $289,114, approximately $158 per square foot. 2900 Aurora Ln is a home located in Midland County with nearby schools including Rusk Elementary School, Alamo Junior High School, and Trinity School of Midland.
Ownership History
Date
Name
Owned For
Owner Type
Purchase Details
Closed on
Jun 17, 2024
Sold by
Mcright Deanna and Jones Deanna
Bought by
Skelton Lonnie David and Skelton Jennifer
Current Estimated Value
Home Financials for this Owner
Home Financials are based on the most recent Mortgage that was taken out on this home.
Original Mortgage
$267,073
Outstanding Balance
$263,793
Interest Rate
7.22%
Mortgage Type
FHA
Estimated Equity
$25,321
Purchase Details
Closed on
May 17, 2018
Sold by
Jones Deanna and Mcright Deanna
Bought by
Jones William Wes
Purchase Details
Closed on
Jul 28, 2003
Sold by
Kendrick Thomas Morgan
Bought by
Mccright Deanna
Purchase Details
Closed on
Sep 1, 2000
Sold by
Secretary Of Hud
Bought by
Mccright Deanna
Purchase Details
Closed on
May 1, 1990
Bought by
Mccright Deanna
Purchase Details
Closed on
May 5, 1989
Bought by
Mccright Deanna
Purchase Details
Closed on
Dec 1, 1988
Bought by
Mccright Deanna
Create a Home Valuation Report for This Property
The Home Valuation Report is an in-depth analysis detailing your home's value as well as a comparison with similar homes in the area
Home Values in the Area
Average Home Value in this Area
Purchase History
| Date | Buyer | Sale Price | Title Company |
|---|---|---|---|
| Skelton Lonnie David | -- | None Listed On Document | |
| Jones William Wes | -- | None Available | |
| Mccright Deanna | -- | -- | |
| Mccright Deanna | -- | -- | |
| Mccright Deanna | -- | -- | |
| Mccright Deanna | -- | -- | |
| Mccright Deanna | -- | -- |
Source: Public Records
Mortgage History
| Date | Status | Borrower | Loan Amount |
|---|---|---|---|
| Open | Skelton Lonnie David | $267,073 |
Source: Public Records
Tax History Compared to Growth
Tax History
| Year | Tax Paid | Tax Assessment Tax Assessment Total Assessment is a certain percentage of the fair market value that is determined by local assessors to be the total taxable value of land and additions on the property. | Land | Improvement |
|---|---|---|---|---|
| 2025 | $2,275 | $250,650 | $21,580 | $229,070 |
| 2024 | $2,279 | $221,190 | $21,580 | $199,610 |
| 2023 | $2,236 | $221,190 | $21,580 | $199,610 |
| 2022 | $3,536 | $226,290 | $21,580 | $204,710 |
| 2021 | $3,811 | $218,740 | $21,580 | $197,160 |
| 2020 | $3,122 | $211,220 | $21,580 | $189,640 |
| 2019 | $3,999 | $211,220 | $21,580 | $189,640 |
| 2018 | $3,666 | $188,570 | $21,580 | $166,990 |
| 2017 | $3,577 | $183,950 | $21,580 | $162,370 |
| 2016 | $3,493 | $179,330 | $21,580 | $157,750 |
| 2015 | -- | $163,680 | $21,580 | $157,750 |
| 2014 | -- | $174,400 | $21,580 | $152,820 |
Source: Public Records
Map
Nearby Homes
- 3802 Suncrest Ave
- 2906 Aurora Ln
- 4313 W Dengar Ave
- 4342 W Dengar Ave
- 3200 Highsky Dr
- 4206 Nelson Rd
- 4310 Nelson Rd
- 3619 W Wadley Ave
- 2000 Freeport Ln
- 3400 Wedgwood St
- 3517 Seaboard Ave
- 3210 Preston Dr
- 3220 Preston Dr
- 1824 Northern Ln
- 1818 Northern Ln
- 4101 Gleneagles Dr
- 3205 Dentcrest Dr Unit B
- 3205 Dentcrest Dr Unit A
- 2306 Abbey Place
- 3400 Salisbury Place
- 2902 Aurora Ln
- 3804 Suncrest Ave
- 2904 Aurora Ln
- 3807 Suncrest Ave
- 2901 Aurora Ln
- 3809 Suncrest Ave
- 3805 Suncrest Ave
- 2903 Aurora Ln
- 2905 Aurora Ln
- 3811 Suncrest Ave
- 3803 Suncrest Ave
- 2907 Aurora Ln
- 3813 Suncrest Ave
- 2909 Aurora Ln
- 4326 W Dengar Ave
- 3800 Suncrest Ave
- 3806 Cimmaron Ave
- 4328 W Dengar Ave
- 3804 Cimmaron Ave
- 3801 Suncrest Ave