Estimated Value: $479,000 - $564,000
4
Beds
3
Baths
3,000
Sq Ft
$174/Sq Ft
Est. Value
About This Home
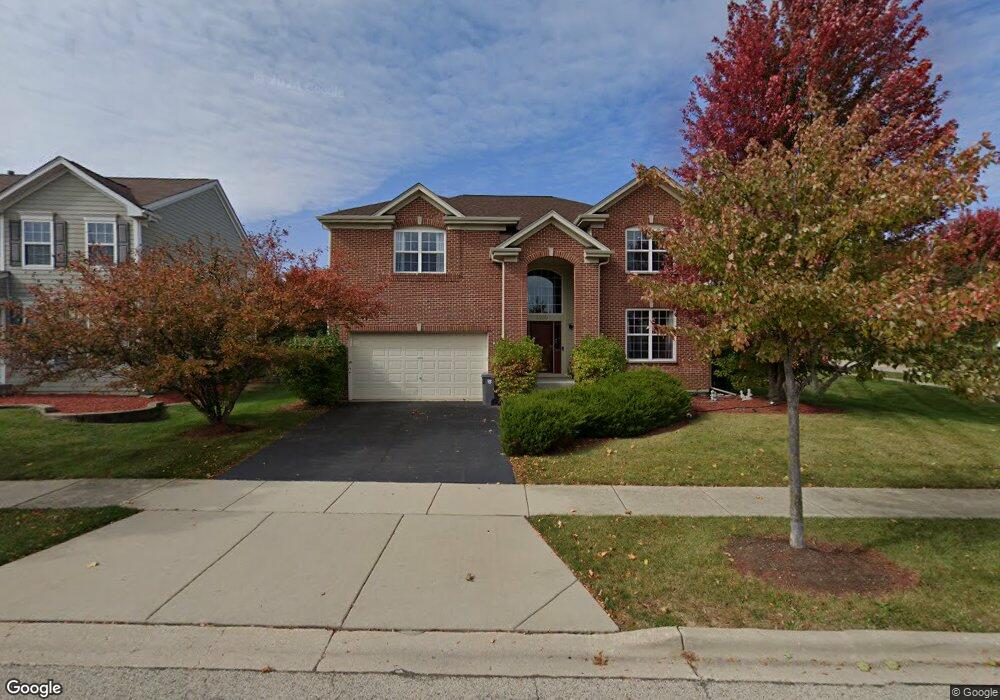
This home is located at 2900 Kelly Dr Unit 1, Elgin, IL 60124 and is currently estimated at $522,765, approximately $174 per square foot. 2900 Kelly Dr Unit 1 is a home located in Kane County with nearby schools including Howard B. Thomas Grade School, Prairie Knolls Middle School, and Central Middle School.
Ownership History
Date
Name
Owned For
Owner Type
Purchase Details
Closed on
Jul 30, 2024
Sold by
Kaur Jasneet
Bought by
Langlois Jorie V and Langlois Kerry
Current Estimated Value
Home Financials for this Owner
Home Financials are based on the most recent Mortgage that was taken out on this home.
Original Mortgage
$485,000
Outstanding Balance
$479,595
Interest Rate
6.95%
Mortgage Type
New Conventional
Estimated Equity
$43,170
Purchase Details
Closed on
Dec 20, 2019
Sold by
Edke Anand L and Kaur Jasneet
Bought by
Kaur Jasneet
Home Financials for this Owner
Home Financials are based on the most recent Mortgage that was taken out on this home.
Original Mortgage
$220,000
Interest Rate
3.12%
Mortgage Type
New Conventional
Purchase Details
Closed on
Sep 29, 2006
Sold by
Waterford Lp
Bought by
Edke Anand L and Kaur Jasneet
Home Financials for this Owner
Home Financials are based on the most recent Mortgage that was taken out on this home.
Original Mortgage
$314,528
Interest Rate
6.5%
Mortgage Type
Purchase Money Mortgage
Create a Home Valuation Report for This Property
The Home Valuation Report is an in-depth analysis detailing your home's value as well as a comparison with similar homes in the area
Home Values in the Area
Average Home Value in this Area
Purchase History
| Date | Buyer | Sale Price | Title Company |
|---|---|---|---|
| Langlois Jorie V | $515,000 | Chicago Title | |
| Kaur Jasneet | -- | Servicelink | |
| Edke Anand L | $391,500 | Stewart Title Company |
Source: Public Records
Mortgage History
| Date | Status | Borrower | Loan Amount |
|---|---|---|---|
| Open | Langlois Jorie V | $485,000 | |
| Previous Owner | Kaur Jasneet | $220,000 | |
| Previous Owner | Edke Anand L | $314,528 |
Source: Public Records
Tax History Compared to Growth
Tax History
| Year | Tax Paid | Tax Assessment Tax Assessment Total Assessment is a certain percentage of the fair market value that is determined by local assessors to be the total taxable value of land and additions on the property. | Land | Improvement |
|---|---|---|---|---|
| 2024 | $12,321 | $148,305 | $41,311 | $106,994 |
| 2023 | $11,817 | $133,982 | $37,321 | $96,661 |
| 2022 | $11,129 | $122,168 | $34,030 | $88,138 |
| 2021 | $10,764 | $114,219 | $31,816 | $82,403 |
| 2020 | $10,453 | $109,039 | $30,373 | $78,666 |
| 2019 | $10,139 | $103,866 | $28,932 | $74,934 |
| 2018 | $11,078 | $111,763 | $27,256 | $84,507 |
| 2017 | $10,669 | $105,656 | $25,767 | $79,889 |
| 2016 | $10,638 | $98,020 | $23,905 | $74,115 |
| 2015 | -- | $89,844 | $21,911 | $67,933 |
| 2014 | -- | $88,734 | $21,640 | $67,094 |
| 2013 | -- | $75,608 | $22,211 | $53,397 |
Source: Public Records
Map
Nearby Homes
- 572 Waterford Rd
- 2907 Kelly Dr
- 2909 Kelly Dr
- 2911 Kelly Dr
- 589 Wexford Dr
- 614 Lismore Cir
- 616 Lismore Cir
- 591 Waterford Rd Unit 269
- 611 Lismore Cir
- 613 Lismore Cir
- 615 Lismore Cir
- 2898 Killarny Dr
- Wren Plan at Waterford - Horizon
- Ridgefield Plan at Waterford - Hartford Series
- Townsend Plan at Waterford - Horizon
- Windsor Plan at Waterford - Hartford Series
- Auburn Plan at Waterford - Hartford Series
- Mesa Verde Plan at Waterford - Horizon
- Rainier Plan at Waterford - Horizon
- Bluestone Plan at Waterford - Hartford Series
- 2900 Kelly Dr Unit 243
- 2902 Kelly Dr
- 571 Waterford Rd
- 362 Waterford Rd
- 365 Waterford Rd
- 364 Waterford Rd
- 2904 Kelly Dr
- 573 Waterford Rd
- 572 Limerick Dr
- 570 Waterford Rd
- 574 Limerick Dr
- 575 Waterford Rd
- 2896 Kelly Dr
- 2897 Kelly Dr
- 576 Limerick Dr
- 3000 Shamrock Cir
- 577 Waterford Rd
- 573 Limerick Dr
- 571 Limerick Dr
- 2998 Shamrock Cir