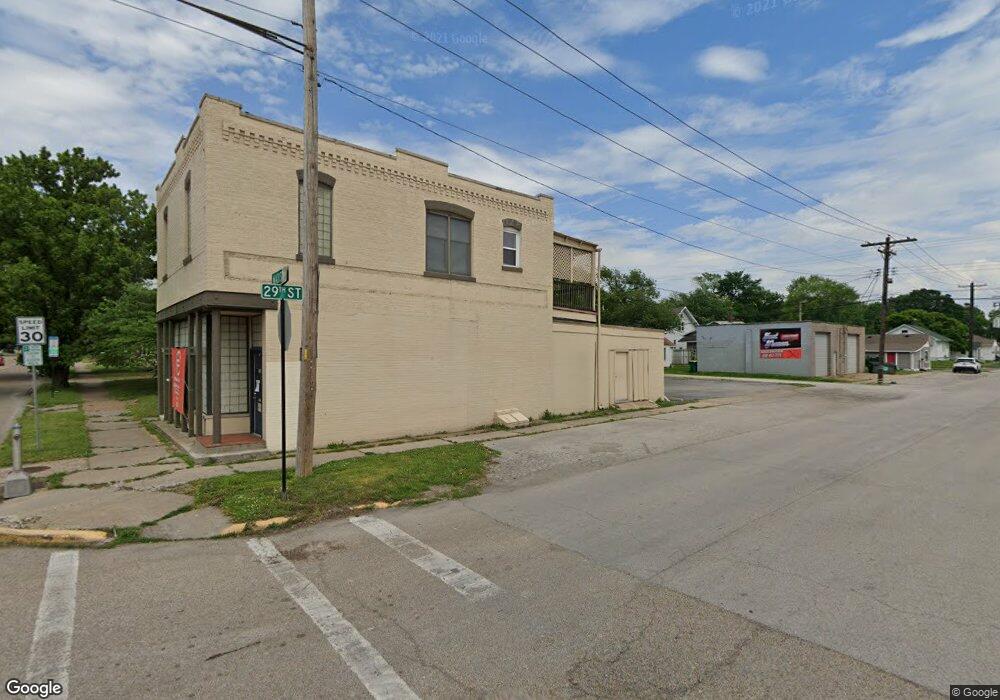
2900 Madison Ave Granite City, IL 62040
--
Bed
--
Bath
3,096
Sq Ft
9,583
Sq Ft Lot
About This Home
This home is located at 2900 Madison Ave, Granite City, IL 62040. 2900 Madison Ave is a home located in Madison County with nearby schools including Granite City High School, Metro East Montessori School, and Rivers of Life Christian School.
Ownership History
Date
Name
Owned For
Owner Type
Purchase Details
Closed on
Jun 29, 2018
Sold by
Birkenmeyer Properties Llc
Bought by
Brown Lorenzo M and Brown Davesa N
Home Financials for this Owner
Home Financials are based on the most recent Mortgage that was taken out on this home.
Original Mortgage
$70,550
Outstanding Balance
$61,277
Interest Rate
4.6%
Mortgage Type
New Conventional
Purchase Details
Closed on
Apr 13, 2016
Sold by
Youth & Community Recreation Center Of E
Bought by
Birkenmeyer Properties Llc
Purchase Details
Closed on
Jul 31, 2013
Sold by
Tebs Properties Llc
Bought by
Dmb Resoruces Inc
Purchase Details
Closed on
Jun 16, 2006
Sold by
Ross Thomas E and Ross Beverly
Bought by
Tebs Properties Llc
Purchase Details
Closed on
Mar 15, 2006
Sold by
Henderson Properties Llc
Bought by
Ross Thomas E and Ross Beverly
Purchase Details
Closed on
Apr 1, 2004
Sold by
Henderson James M
Bought by
Henderson Properties Llc
Create a Home Valuation Report for This Property
The Home Valuation Report is an in-depth analysis detailing your home's value as well as a comparison with similar homes in the area
Home Values in the Area
Average Home Value in this Area
Purchase History
| Date | Buyer | Sale Price | Title Company |
|---|---|---|---|
| Brown Lorenzo M | $83,000 | Pontoon Title | |
| Birkenmeyer Properties Llc | $13,500 | Attorney | |
| Dmb Resoruces Inc | $50,000 | None Available | |
| Tebs Properties Llc | -- | None Available | |
| Ross Thomas E | $200,000 | Fatic | |
| Henderson Properties Llc | -- | -- |
Source: Public Records
Mortgage History
| Date | Status | Borrower | Loan Amount |
|---|---|---|---|
| Open | Brown Lorenzo M | $70,550 | |
| Closed | Ross Thomas E | $0 |
Source: Public Records
Tax History Compared to Growth
Tax History
| Year | Tax Paid | Tax Assessment Tax Assessment Total Assessment is a certain percentage of the fair market value that is determined by local assessors to be the total taxable value of land and additions on the property. | Land | Improvement |
|---|---|---|---|---|
| 2024 | $2,513 | $34,830 | $6,220 | $28,610 |
| 2023 | $2,513 | $31,400 | $5,610 | $25,790 |
| 2022 | $2,419 | $28,770 | $5,140 | $23,630 |
| 2021 | $2,170 | $26,980 | $4,820 | $22,160 |
| 2020 | $2,090 | $25,760 | $4,600 | $21,160 |
| 2019 | $1,996 | $24,420 | $4,360 | $20,060 |
| 2018 | $2,582 | $23,700 | $4,230 | $19,470 |
| 2017 | $447 | $4,330 | $3,330 | $1,000 |
| 2016 | $7,689 | $73,160 | $4,390 | $68,770 |
| 2015 | $6,933 | $73,160 | $4,390 | $68,770 |
| 2014 | $6,933 | $73,160 | $4,390 | $68,770 |
| 2013 | $6,933 | $73,160 | $4,390 | $68,770 |
Source: Public Records
Map
Nearby Homes
- 2900 Iowa St
- 2855 Iowa St
- 2909 Grand Ave
- 2806 Madison Ave
- 2900 State St
- 2800 Ralph St
- 3029 Iowa St
- 2720 Iowa St Unit A, B & C
- 2664 E 28th St
- 2706 Iowa St
- 3043 Myrtle Ave
- 2502 Propes Ave
- 2653 Washington Ave
- 2656 State St
- 2922 Marshall Ave
- 3128 Carlson Ave
- 2701 Marshall Ave
- 2621 Grand Ave
- 3017 Wayne Ave
- 2415 Hodges Ave
- 2908 Madison Ave
- 2912 Madison Ave
- 2901 Iowa St
- 2905 Iowa St
- 2916 Madison Ave
- 2907 Iowa St
- 2905 Madison Ave
- 2907 Madison Ave
- 2917 Iowa St
- 2875 Iowa St
- 2881 Madison Ave
- 2919 Iowa St
- 2871 Iowa St
- 2917 Madison Ave
- 2871 Madison Ave
- 2921 Iowa St
- 2864 Madison Ave
- 2869 Iowa St
- 2925 Madison Ave
- 2869 Madison Ave