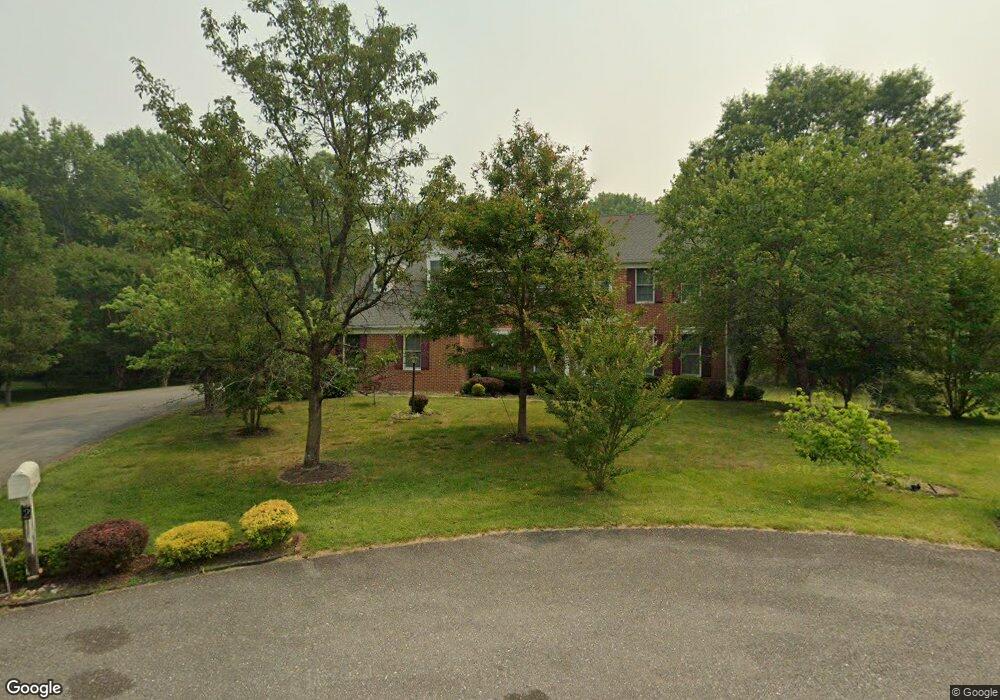
2900 Native Dancer Ct Bowie, MD 20721
Woodmore NeighborhoodEstimated Value: $723,313 - $945,000
Studio
3
Baths
3,580
Sq Ft
$231/Sq Ft
Est. Value
About This Home
This home is located at 2900 Native Dancer Ct, Bowie, MD 20721 and is currently estimated at $825,578, approximately $230 per square foot. 2900 Native Dancer Ct is a home located in Prince George's County with nearby schools including Woodmore Elementary School, Benjamin Tasker Middle School, and Bowie High School.
Ownership History
Date
Name
Owned For
Owner Type
Purchase Details
Closed on
Jun 3, 2016
Bought by
Vaughan Linda
Current Estimated Value
Home Financials for this Owner
Home Financials are based on the most recent Mortgage that was taken out on this home.
Original Mortgage
$371,434
Outstanding Balance
$295,687
Interest Rate
3.66%
Estimated Equity
$529,891
Purchase Details
Closed on
Jan 16, 1996
Sold by
Pulte Home Corp
Bought by
Vaughan John W J and Vaughan Linda
Create a Home Valuation Report for This Property
The Home Valuation Report is an in-depth analysis detailing your home's value as well as a comparison with similar homes in the area
Home Values in the Area
Average Home Value in this Area
Purchase History
| Date | Buyer | Sale Price | Title Company |
|---|---|---|---|
| Vaughan Linda | -- | -- | |
| Vaughan John W J | $272,000 | -- |
Source: Public Records
Mortgage History
| Date | Status | Borrower | Loan Amount |
|---|---|---|---|
| Open | Vaughan Linda | $371,434 | |
| Closed | Vaughan Linda | -- |
Source: Public Records
Tax History
| Year | Tax Paid | Tax Assessment Tax Assessment Total Assessment is a certain percentage of the fair market value that is determined by local assessors to be the total taxable value of land and additions on the property. | Land | Improvement |
|---|---|---|---|---|
| 2025 | $8,242 | $729,900 | $107,200 | $622,700 |
| 2024 | $8,242 | $682,433 | -- | -- |
| 2023 | $7,879 | $634,967 | $0 | $0 |
| 2022 | $7,440 | $587,500 | $107,200 | $480,300 |
| 2021 | $7,104 | $559,133 | $0 | $0 |
| 2020 | $6,927 | $530,767 | $0 | $0 |
| 2019 | $6,712 | $502,400 | $103,600 | $398,800 |
| 2018 | $6,396 | $461,767 | $0 | $0 |
| 2017 | $6,120 | $421,133 | $0 | $0 |
| 2016 | -- | $380,500 | $0 | $0 |
| 2015 | $6,372 | $371,433 | $0 | $0 |
| 2014 | $6,372 | $362,367 | $0 | $0 |
Source: Public Records
Map
Nearby Homes
- 2836 Nomad Ct W
- 2815 Nomad Ct E
- 3016 N Dale Ln
- 2707 Margary Timbers Ct
- 2701 Neman Ct
- 2513 Pittland Ln
- 15403 Pegg Ct
- 2632 Nemo Ct
- 14928 Nashua Ln
- 15423 Doveheart Ln
- 2354 Mitchellville Rd
- 2415 Mitchellville Rd
- 15806 Appleton Terrace
- 2384 Mitchellville Rd
- 3433 Elenoir Ct
- 2334 Mitchellville Rd
- 2263 Prince of Wales Ct
- 15210 Endicott Dr
- 15610 Everglade Ln Unit E102
- 15612 Everglade Ln Unit 404
- 2901 Native Dancer Ct
- 2902 Native Dancer Ct
- 2905 Native Dancer Ct
- 2904 Native Dancer Ct
- 14608 Man o War Dr
- 14600 Man o War Dr
- 2909 Native Dancer Ct
- 14610 Man o War Dr
- 2908 Native Dancer Ct
- 14508 Man o War Dr
- 3016 Nutwood Ln
- 3014 Nutwood Ln
- 14603 Man o War Dr
- 14611 Man o War Dr
- 3018 Nutwood Ln
- 3020 Nutwood Ln
- 3012 Nutwood Ln
- 3022 Nutwood Ln
- 14506 Man o War Dr
- 2911 Native Dancer Ct
Your Personal Tour Guide
Ask me questions while you tour the home.