2900 Native Dancer Ct Bowie, MD 20721
Woodmore NeighborhoodEstimated Value: $771,319 - $925,000
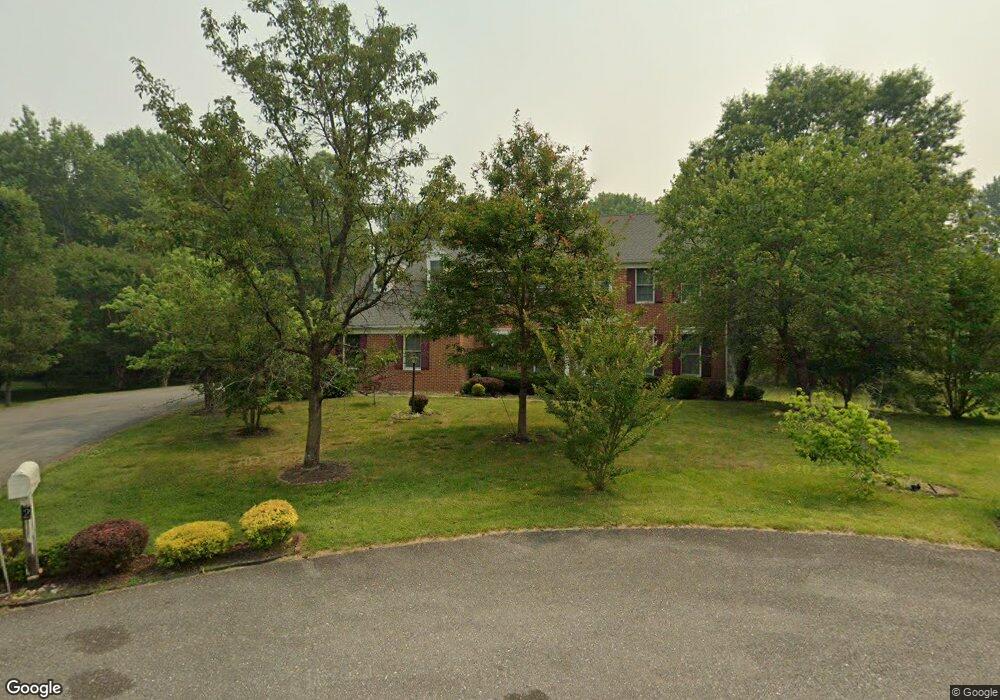
About This Home
This home is located at 2900 Native Dancer Ct, Bowie, MD 20721 and is currently estimated at $862,080, approximately $240 per square foot. 2900 Native Dancer Ct is a home located in Prince George's County with nearby schools including Woodmore Elementary School, Benjamin Tasker Middle School, and Bowie High School.
Ownership History
We collect this data history from publicly available records. To have your information removed, we recommend requesting removal directly through your county’s website.
Purchase Details
Home Financials for this Owner
Home Financials are based on the most recent Mortgage that was taken out on this home.Purchase Details
Home Values in the Area
Average Home Value in this Area
Purchase History
We collect this data history from publicly available records. To have your information removed, we recommend requesting removal directly through your county’s website.
| Date | Buyer | Sale Price | Title Company |
|---|---|---|---|
| -- | -- | ||
| $272,000 | -- |
Mortgage History
We collect this data history from publicly available records. To have your information removed, we recommend requesting removal directly through your county’s website.
| Date | Status | Borrower | Loan Amount |
|---|---|---|---|
| Open | $371,434 | ||
| Closed | -- |
Tax History
We collect this data history from publicly available records. To have your information removed, we recommend requesting removal directly through your county’s website.
| Year | Tax Paid | Tax Assessment Tax Assessment Total Assessment is a certain percentage of the fair market value that is determined by local assessors to be the total taxable value of land and additions on the property. | Land | Improvement |
|---|---|---|---|---|
| 2025 | $8,242 | $729,900 | $107,200 | $622,700 |
| 2024 | $8,242 | $682,433 | -- | -- |
| 2023 | $7,879 | $634,967 | $0 | $0 |
| 2022 | $7,440 | $587,500 | $107,200 | $480,300 |
| 2021 | $7,104 | $559,133 | $0 | $0 |
| 2020 | $6,927 | $530,767 | $0 | $0 |
| 2019 | $6,712 | $502,400 | $103,600 | $398,800 |
| 2018 | $6,396 | $461,767 | $0 | $0 |
| 2017 | $6,120 | $421,133 | $0 | $0 |
| 2016 | -- | $380,500 | $0 | $0 |
| 2015 | $6,372 | $371,433 | $0 | $0 |
| 2014 | $6,372 | $362,367 | $0 | $0 |
Map
- 15413 N Oak Ct
- 2815 Nomad Ct E
- 15005 Narrows Ln
- 15013 Narrows Ln
- 15435 Neman Dr
- 2504 Panther Ln
- 14601 Driftwood Rd
- 3006 New Oak Ln
- 15533 N Oak Ct
- 2800 Nestor Ct
- 2618 Nemo Ct
- 15006 Northshire Place
- 14935 Nashua Ln
- 2500 Pittland Ln
- 3511 Esquilin Terrace
- 14906 Doveheart Ln
- 3001 Antler Ct N
- 15512 Empress Way
- 3303 Dunwood Ridge Terrace
- 15423 Doveheart Ln
- 2901 Native Dancer Ct
- 2902 Native Dancer Ct
- 2905 Native Dancer Ct
- 2904 Native Dancer Ct
- 14608 Man o War Dr
- 14600 Man o War Dr
- 2909 Native Dancer Ct
- 14610 Man o War Dr
- 2908 Native Dancer Ct
- 14508 Man o War Dr
- 3016 Nutwood Ln
- 3014 Nutwood Ln
- 14603 Man o War Dr
- 14611 Man o War Dr
- 3018 Nutwood Ln
- 3020 Nutwood Ln
- 3012 Nutwood Ln
- 3022 Nutwood Ln
- 14506 Man o War Dr
- 2911 Native Dancer Ct
Ask me questions while you tour the home.