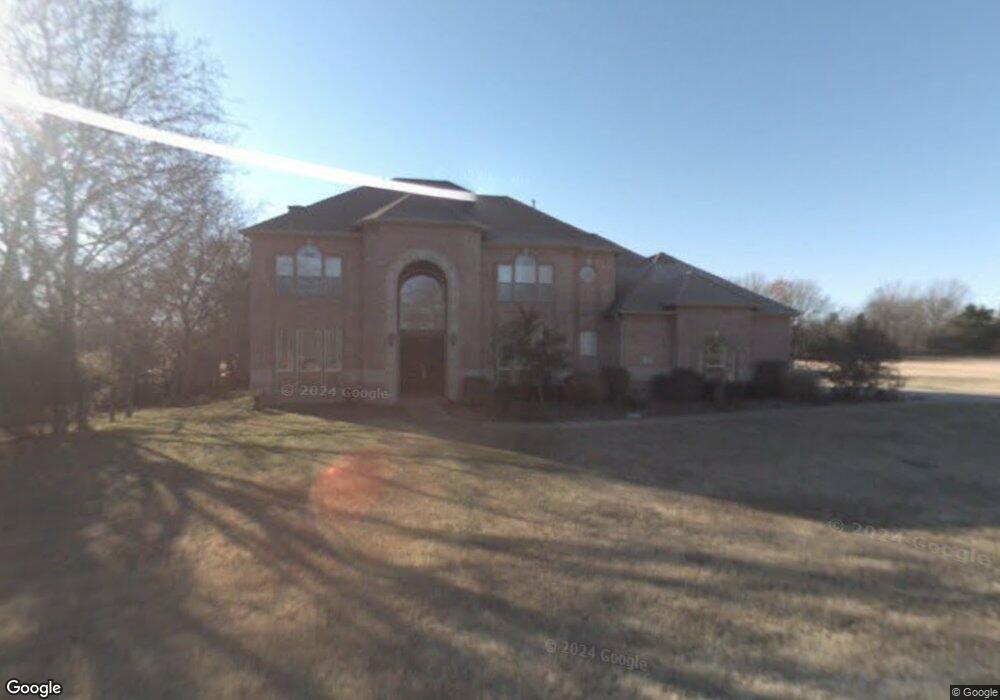
2900 Wellington Dr Sherman, TX 75092
Estimated Value: $680,377 - $1,118,000
4
Beds
4
Baths
3,959
Sq Ft
$224/Sq Ft
Est. Value
About This Home
This home is located at 2900 Wellington Dr, Sherman, TX 75092 and is currently estimated at $887,344, approximately $224 per square foot. 2900 Wellington Dr is a home located in Grayson County with nearby schools including S&S Consolidated Elementary School, S&S Consolidated Middle School, and S. & S. Cons H.S..
Ownership History
Date
Name
Owned For
Owner Type
Purchase Details
Closed on
Nov 20, 2019
Sold by
Ro Kyu Hyun and Ro Sung Kyung
Bought by
Ro Sung Kyung
Current Estimated Value
Home Financials for this Owner
Home Financials are based on the most recent Mortgage that was taken out on this home.
Original Mortgage
$159,998
Outstanding Balance
$106,634
Interest Rate
3.18%
Mortgage Type
New Conventional
Estimated Equity
$780,710
Purchase Details
Closed on
Mar 28, 2014
Sold by
Federal Home Loan Mortgage Corporation
Bought by
Ro Kyu Hyun and Ro Sung Kyung
Home Financials for this Owner
Home Financials are based on the most recent Mortgage that was taken out on this home.
Original Mortgage
$235,156
Interest Rate
3.38%
Mortgage Type
New Conventional
Purchase Details
Closed on
Jun 15, 2007
Sold by
Knapp Merlyn E and Knapp Susan M
Bought by
Conway Stafford A and Conway Wendy J
Home Financials for this Owner
Home Financials are based on the most recent Mortgage that was taken out on this home.
Original Mortgage
$87,600
Interest Rate
6.19%
Mortgage Type
Stand Alone Second
Create a Home Valuation Report for This Property
The Home Valuation Report is an in-depth analysis detailing your home's value as well as a comparison with similar homes in the area
Home Values in the Area
Average Home Value in this Area
Purchase History
| Date | Buyer | Sale Price | Title Company |
|---|---|---|---|
| Ro Sung Kyung | -- | Servicelink | |
| Ro Kyu Hyun | -- | Chicago Title Servicelink Br | |
| Conway Stafford A | -- | Allegiance Title Company |
Source: Public Records
Mortgage History
| Date | Status | Borrower | Loan Amount |
|---|---|---|---|
| Open | Ro Sung Kyung | $159,998 | |
| Closed | Ro Kyu Hyun | $235,156 | |
| Previous Owner | Conway Stafford A | $87,600 | |
| Previous Owner | Conway Stafford A | $350,400 |
Source: Public Records
Tax History Compared to Growth
Tax History
| Year | Tax Paid | Tax Assessment Tax Assessment Total Assessment is a certain percentage of the fair market value that is determined by local assessors to be the total taxable value of land and additions on the property. | Land | Improvement |
|---|---|---|---|---|
| 2025 | $11,673 | $696,622 | $123,633 | $572,989 |
| 2024 | $13,140 | $657,873 | $0 | $0 |
| 2023 | $10,477 | $598,066 | $0 | $0 |
| 2022 | $11,677 | $543,696 | $0 | $0 |
| 2021 | $11,794 | $494,269 | $56,782 | $437,487 |
| 2020 | $11,374 | $475,158 | $56,782 | $418,376 |
| 2019 | $10,775 | $422,819 | $43,896 | $378,923 |
| 2018 | $10,109 | $426,727 | $65,815 | $360,912 |
| 2017 | $9,685 | $412,263 | $65,815 | $346,448 |
| 2016 | $9,365 | $416,810 | $65,815 | $350,995 |
| 2015 | $7,814 | $362,374 | $65,815 | $296,559 |
| 2014 | $8,495 | $362,374 | $65,815 | $296,559 |
Source: Public Records
Map
Nearby Homes
- 2910 Wellington Dr
- 2904 W Washington St
- 302 Asterwood Ln
- 3716 Spring Run Dr
- 314 Asterwood Ln
- 3613 Oleander Place
- 3712 Spring Run Dr
- 3715 Oleander Place
- 3707 Oleander Place
- 3071 W Washington St
- 2705 Spring Lake Dr
- 800 Bentbrook Ln
- 2806 Spring Lake Dr
- 2714 Stonecrest Dr
- 2710 Stonecrest Dr
- 1305 Bentbrook Ln
- 1617 Heritage Creek Dr
- The Knollwood Plan at Heritage Crossing
- The Howe Plan at Heritage Crossing
- The Plano at Heritage Crossing
- 2704 Cambridge Dr
- 2806 Wellington Dr
- 2905 Wellington Dr
- 2906 Wellington Dr
- 2807 Wellington Dr
- 2909 Wellington Dr
- 2800 Wellington Dr
- 2705 Cambridge Way
- 2708 Cambridge Dr
- 2700 W Washington St
- 2810 W Washington St
- 2811 W Washington St
- TBD Washington & Creekbend
- 2805 W Washington St
- 2606 Creekbend Cir
- 2701 W Washington St
- 2908 W Washington St
- 2601 Creekbend Cir
- 2600 Creekbend Cir
- 2912 W Washington St