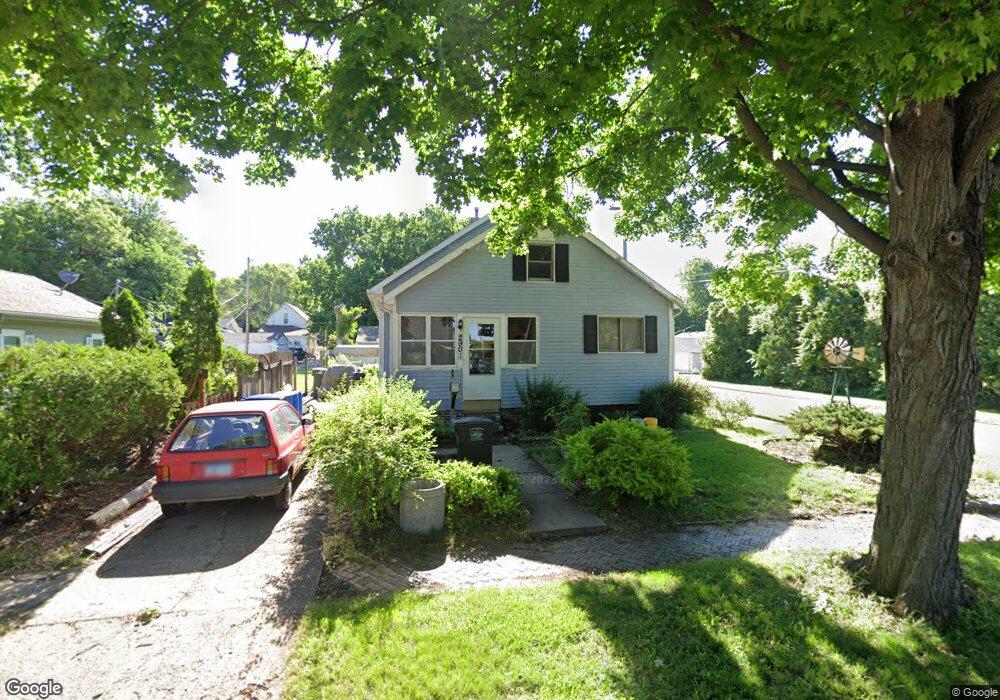
2901 3rd St Des Moines, IA 50313
Highland Park NeighborhoodEstimated Value: $126,077 - $159,000
2
Beds
1
Bath
1,172
Sq Ft
$120/Sq Ft
Est. Value
About This Home
This home is located at 2901 3rd St, Des Moines, IA 50313 and is currently estimated at $141,019, approximately $120 per square foot. 2901 3rd St is a home located in Polk County with nearby schools including Oak Park Elementary School, Harding Middle School, and North High School.
Ownership History
Date
Name
Owned For
Owner Type
Purchase Details
Closed on
Oct 13, 2000
Sold by
Dingman Catheryn A and Dingman Michael
Bought by
Ziebell Richard W C
Current Estimated Value
Purchase Details
Closed on
Aug 16, 2000
Sold by
Gambrall Marilyn and Estate Of John P Gambrall Sr
Bought by
Dingman Catheryn A and Ziebell Richard W C
Purchase Details
Closed on
May 18, 2000
Sold by
Gambrall James and Gambrall Evelyn
Bought by
Dingman Catheryn and Ziebell Richard W C
Purchase Details
Closed on
Nov 29, 1999
Sold by
Eischeid Juanita M and Eischeid George
Bought by
Dingman Catheryn and Ziebell Richard W C
Purchase Details
Closed on
Nov 22, 1999
Sold by
Gambrall Louise
Bought by
Dingman Catheryn and Ziebell Richard W C
Create a Home Valuation Report for This Property
The Home Valuation Report is an in-depth analysis detailing your home's value as well as a comparison with similar homes in the area
Home Values in the Area
Average Home Value in this Area
Purchase History
| Date | Buyer | Sale Price | Title Company |
|---|---|---|---|
| Ziebell Richard W C | -- | -- | |
| Dingman Catheryn A | -- | -- | |
| Dingman Catheryn | -- | -- | |
| Dingman Catheryn | $18,500 | -- | |
| Dingman Catheryn | -- | -- |
Source: Public Records
Tax History
| Year | Tax Paid | Tax Assessment Tax Assessment Total Assessment is a certain percentage of the fair market value that is determined by local assessors to be the total taxable value of land and additions on the property. | Land | Improvement |
|---|---|---|---|---|
| 2025 | $540 | $98,700 | $18,400 | $80,300 |
| 2024 | $540 | $85,300 | $15,800 | $69,500 |
| 2023 | $660 | $85,300 | $15,800 | $69,500 |
| 2022 | $648 | $70,400 | $13,700 | $56,700 |
| 2021 | $620 | $74,400 | $13,700 | $60,700 |
| 2020 | $1,454 | $64,900 | $12,000 | $52,900 |
| 2019 | $1,568 | $64,900 | $12,000 | $52,900 |
| 2018 | $1,548 | $66,900 | $10,400 | $56,500 |
| 2017 | $1,554 | $66,900 | $10,400 | $56,500 |
| 2016 | $1,510 | $66,000 | $10,200 | $55,800 |
| 2015 | $1,510 | $66,000 | $10,200 | $55,800 |
| 2014 | $1,668 | $71,500 | $10,900 | $60,600 |
Source: Public Records
Map
Nearby Homes
Your Personal Tour Guide
Ask me questions while you tour the home.