
Landlord's Agent in 2026
Cheryl Tucker
Cheryl Tucker Realty
(512) 705-9010
1 in this area
53 Total Sales
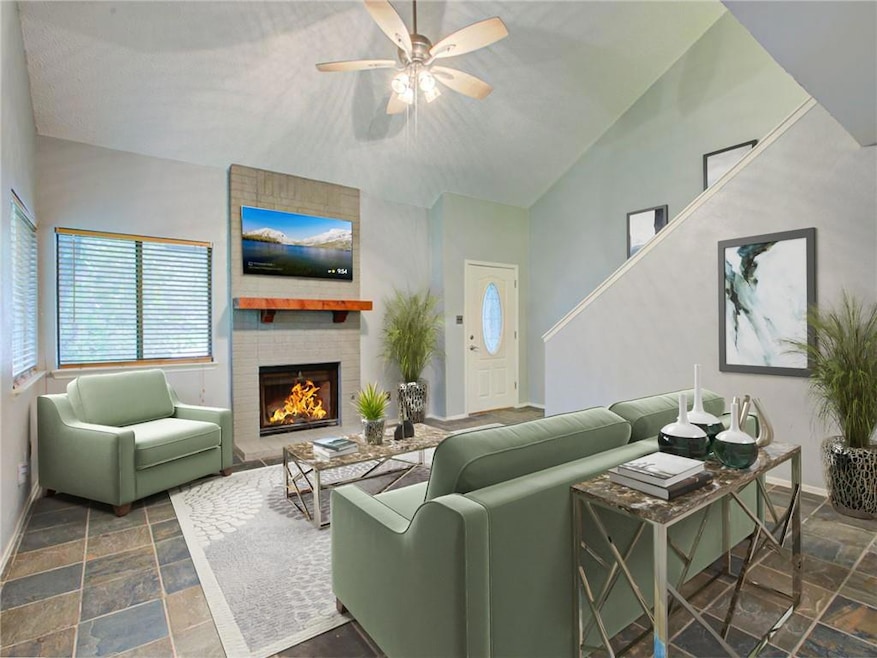
Nicely updated duplex in 78704, available for an immediate lease start. Awesome location off S. Lamar and Bluebonnet. Be close to everything South Lamar district has to offer! 3 bedrooms, 2 full baths, privated, fenced backyard. No carpet anywhere! Refrigerator, washer, dryer supplied for tenant. Pet friendly! Wood burning fireplace.
Last Agent to Rent the Property
Cheryl Tucker Realty Brokerage Phone: (512) 705-9010 License #0565996 Listed on: 10/15/2025
Co-Listed By
Santos Realty & Associates LLC Brokerage Phone: (512) 705-9010 License #0747251
| Date | Event | Price | List to Sale | Price per Sq Ft |
|---|---|---|---|---|
| 02/26/2026 02/26/26 | Rented | $2,100 | -3.4% | -- |
| 02/11/2026 02/11/26 | Price Changed | $2,175 | -3.3% | $1 / Sq Ft |
| 01/23/2026 01/23/26 | Price Changed | $2,250 | -4.3% | $1 / Sq Ft |
| 11/10/2025 11/10/25 | Price Changed | $2,350 | -2.1% | $1 / Sq Ft |
| 10/15/2025 10/15/25 | For Rent | $2,400 | +9.1% | -- |
| 10/08/2024 10/08/24 | Rented | $2,200 | 0.0% | -- |
| 09/14/2024 09/14/24 | Price Changed | $2,200 | -8.3% | $1 / Sq Ft |
| 09/12/2024 09/12/24 | Price Changed | $2,400 | -4.0% | $1 / Sq Ft |
| 09/04/2024 09/04/24 | For Rent | $2,500 | 0.0% | -- |
| 08/27/2021 08/27/21 | Rented | $2,500 | 0.0% | -- |
| 08/21/2021 08/21/21 | Under Contract | -- | -- | -- |
| 08/19/2021 08/19/21 | For Rent | $2,500 | +19.0% | -- |
| 11/17/2018 11/17/18 | Rented | $2,100 | 0.0% | -- |
| 11/14/2018 11/14/18 | Under Contract | -- | -- | -- |
| 11/02/2018 11/02/18 | Price Changed | $2,100 | -4.5% | $1 / Sq Ft |
| 10/16/2018 10/16/18 | For Rent | $2,200 | +33.3% | -- |
| 11/22/2016 11/22/16 | Rented | $1,650 | -5.7% | -- |
| 11/22/2016 11/22/16 | Under Contract | -- | -- | -- |
| 10/11/2016 10/11/16 | For Rent | $1,750 | +6.1% | -- |
| 08/13/2016 08/13/16 | Rented | $1,650 | -5.7% | -- |
| 08/13/2016 08/13/16 | Under Contract | -- | -- | -- |
| 08/01/2016 08/01/16 | For Rent | $1,750 | +6.1% | -- |
| 08/27/2015 08/27/15 | Rented | $1,650 | 0.0% | -- |
| 08/27/2015 08/27/15 | Under Contract | -- | -- | -- |
| 08/01/2015 08/01/15 | For Rent | $1,650 | +3.1% | -- |
| 09/01/2014 09/01/14 | Rented | $1,600 | -11.1% | -- |
| 08/22/2014 08/22/14 | Under Contract | -- | -- | -- |
| 07/01/2014 07/01/14 | For Rent | $1,800 | +5.9% | -- |
| 07/10/2013 07/10/13 | Rented | $1,700 | 0.0% | -- |
| 07/10/2013 07/10/13 | Under Contract | -- | -- | -- |
| 06/17/2013 06/17/13 | For Rent | $1,700 | 0.0% | -- |
| 05/13/2013 05/13/13 | Rented | $1,700 | -5.6% | -- |
| 05/13/2013 05/13/13 | Under Contract | -- | -- | -- |
| 04/16/2013 04/16/13 | For Rent | $1,800 | -- | -- |
Landlord's Agent in 2026
Cheryl Tucker
Cheryl Tucker Realty
(512) 705-9010
1 in this area
53 Total Sales
Y
Landlord's Co-Listing Agent in 2026
Yesenia Beltran
Santos Realty & Associates LLC
(512) 674-5774
5 Total Sales
Tenant's Agent in 2026
Finesse Haverly
Real Broker, LLC
(713) 320-6853
6 Total Sales
Buyer's Agent in 2024
Yolanda Lara
Coldwell Banker Realty
(512) 825-0133
24 Total Sales
M
Buyer's Agent in 2018
Melanie Price
Team Price Real Estate
(512) 897-5394
35 Total Sales
G
Buyer's Agent in 2016
Gregg Friedman
Bryan Bjerke
(512) 786-1051
4 Total Sales
Source: Unlock MLS (Austin Board of REALTORS®)
MLS Number: 7577829
Disclaimer: Certain information contained herein is derived from information provided by parties other than Homes.com. All information provided is deemed reliable, but is not guaranteed to be accurate and should be independently verified.
![]() Based on information from the Austin Board of REALTORS® (alternatively, from ACTRIS). Neither the Board nor ACTRIS guarantees or is in any way responsible for its accuracy. All data is provided “AS IS” and with all faults. Data maintained by the Board or ACTRIS may not reflect all real estate activity in the market.
Based on information from the Austin Board of REALTORS® (alternatively, from ACTRIS). Neither the Board nor ACTRIS guarantees or is in any way responsible for its accuracy. All data is provided “AS IS” and with all faults. Data maintained by the Board or ACTRIS may not reflect all real estate activity in the market.
Information being provided is for consumers’ personal, non-commercial use and may not be used for any purpose other than to identify prospective properties consumers may be interested in purchasing. All data is obtained from various sources and may not have been verified by broker or MLS GRID. Supplied Open House Information is subject to change without notice. All information should be independently reviewed and verified for accuracy. Properties may or may not be listed by the office/agent presenting the information. Some IDX listings have been excluded from this website.
Based on information submitted to the MLS GRID
Ask me questions while you tour the home.