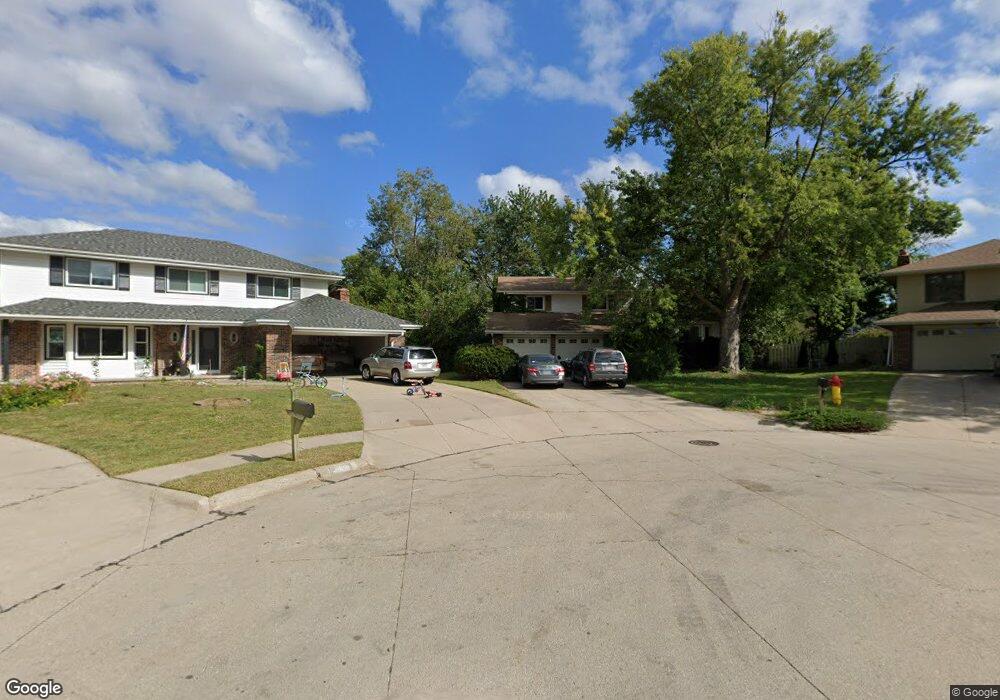
2901 Daniell Cir Bellevue, NE 68123
Estimated Value: $317,000 - $332,000
4
Beds
3
Baths
2,355
Sq Ft
$137/Sq Ft
Est. Value
About This Home
This home is located at 2901 Daniell Cir, Bellevue, NE 68123 and is currently estimated at $322,147, approximately $136 per square foot. 2901 Daniell Cir is a home located in Sarpy County with nearby schools including Leonard Lawrence Elementary School, Lewis & Clark Middle School, and Bellevue West High School.
Ownership History
Date
Name
Owned For
Owner Type
Purchase Details
Closed on
Oct 5, 2011
Sold by
Hernandez Joe A and Hernandez Tasha
Bought by
Brown Anthony T
Current Estimated Value
Home Financials for this Owner
Home Financials are based on the most recent Mortgage that was taken out on this home.
Original Mortgage
$153,994
Outstanding Balance
$104,929
Interest Rate
4.08%
Estimated Equity
$217,218
Purchase Details
Closed on
May 25, 2010
Sold by
Hernandez Kristin M and Raupp Kristin M
Bought by
Hernandez Joe A
Purchase Details
Closed on
Sep 24, 2004
Sold by
Coburn Arthur E and Coburn Jean E
Bought by
Raupp Kristin M and Hernandez Joe A
Home Financials for this Owner
Home Financials are based on the most recent Mortgage that was taken out on this home.
Original Mortgage
$172,100
Interest Rate
5.74%
Create a Home Valuation Report for This Property
The Home Valuation Report is an in-depth analysis detailing your home's value as well as a comparison with similar homes in the area
Home Values in the Area
Average Home Value in this Area
Purchase History
| Date | Buyer | Sale Price | Title Company |
|---|---|---|---|
| Brown Anthony T | $158,000 | Nebraska Land Title & Abstra | |
| Hernandez Joe A | -- | None Available | |
| Raupp Kristin M | $169,000 | -- |
Source: Public Records
Mortgage History
| Date | Status | Borrower | Loan Amount |
|---|---|---|---|
| Open | Brown Anthony T | $153,994 | |
| Previous Owner | Raupp Kristin M | $172,100 |
Source: Public Records
Tax History Compared to Growth
Tax History
| Year | Tax Paid | Tax Assessment Tax Assessment Total Assessment is a certain percentage of the fair market value that is determined by local assessors to be the total taxable value of land and additions on the property. | Land | Improvement |
|---|---|---|---|---|
| 2025 | $4,418 | $267,164 | $46,000 | $221,164 |
| 2024 | $4,872 | $252,987 | $44,000 | $208,987 |
| 2023 | $4,872 | $230,735 | $39,000 | $191,735 |
| 2022 | $4,504 | $209,311 | $35,000 | $174,311 |
| 2021 | $4,189 | $192,587 | $30,000 | $162,587 |
| 2020 | $3,997 | $183,182 | $30,000 | $153,182 |
| 2019 | $3,765 | $173,603 | $30,000 | $143,603 |
| 2018 | $3,496 | $165,550 | $25,000 | $140,550 |
| 2017 | $3,467 | $163,031 | $25,000 | $138,031 |
| 2016 | $3,154 | $151,624 | $25,000 | $126,624 |
| 2015 | $2,987 | $144,404 | $25,000 | $119,404 |
| 2014 | $2,970 | $142,664 | $25,000 | $117,664 |
| 2012 | -- | $146,085 | $25,000 | $121,085 |
Source: Public Records
Map
Nearby Homes
- 12901 S 29th Place
- 12722 S 28th Ave
- 2940 Leawood Dr
- 13403 S 28th St
- 3102 Redwing Dr
- 2512 Nottingham Dr
- 3105 Leawood Dr
- 3105 Mirror Cir
- 3108 Mirror Cir
- 2923 Blackhawk Dr
- 3309 Lookingglass Dr
- 3506 Lynnwood Dr
- 3504 Sheridan Cir
- 12915 Forestdale Dr
- 3508 Jason Cir
- 12750 Forestdale Dr
- 3728 Schuemann Dr
- 3716 Lookingglass Dr
- 3738 Falcon Dr
- 12741 Ridgeview Cir
- 2903 Daniell Cir
- 2902 Daniell Cir
- 13006 S 29th Place
- 13004 S 29th Place
- 13008 S 29th Place
- 2908 Lynnwood Dr
- 2905 Daniell Cir
- 13002 S 29th Place
- 2910 Lynnwood Dr
- 2904 Daniell Cir
- 13010 S 29th Place
- 2907 Daniell Cir
- 2906 Daniell Cir
- 12910 S 29th Place
- 2914 Lynnwood Dr
- 2908 Daniell Cir
- 2903 Redwing Cir
- 12908 S 29th Place
- 13003 S 29th Place
- 2909 Daniell Cir