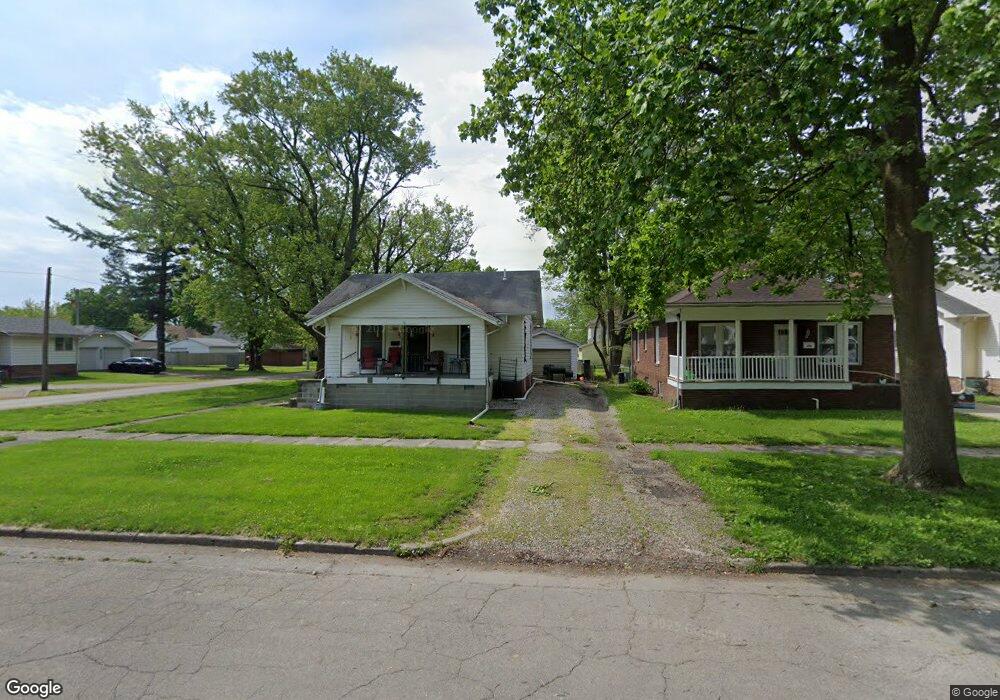
2901 Richmond Ave Mattoon, IL 61938
Estimated Value: $86,359 - $97,000
2
Beds
1
Bath
979
Sq Ft
$93/Sq Ft
Est. Value
About This Home
This home is located at 2901 Richmond Ave, Mattoon, IL 61938 and is currently estimated at $90,840, approximately $92 per square foot. 2901 Richmond Ave is a home located in Coles County with nearby schools including Mattoon High School.
Ownership History
Date
Name
Owned For
Owner Type
Purchase Details
Closed on
Jul 9, 2014
Sold by
Gass Brian E and Gass Brandy N
Bought by
Seibert Donald L
Current Estimated Value
Home Financials for this Owner
Home Financials are based on the most recent Mortgage that was taken out on this home.
Original Mortgage
$41,800
Outstanding Balance
$32,100
Interest Rate
4.38%
Mortgage Type
New Conventional
Estimated Equity
$58,740
Purchase Details
Closed on
Sep 30, 2008
Sold by
Crist Vicki M
Bought by
Gass Brian E and Gass Brandy N
Home Financials for this Owner
Home Financials are based on the most recent Mortgage that was taken out on this home.
Original Mortgage
$44,800
Interest Rate
6.52%
Mortgage Type
New Conventional
Purchase Details
Closed on
Nov 25, 2005
Sold by
Eaton Tony M and Eaton Donna J
Bought by
Crist Vicki M
Home Financials for this Owner
Home Financials are based on the most recent Mortgage that was taken out on this home.
Original Mortgage
$44,000
Interest Rate
6.13%
Mortgage Type
Purchase Money Mortgage
Create a Home Valuation Report for This Property
The Home Valuation Report is an in-depth analysis detailing your home's value as well as a comparison with similar homes in the area
Home Values in the Area
Average Home Value in this Area
Purchase History
| Date | Buyer | Sale Price | Title Company |
|---|---|---|---|
| Seibert Donald L | $44,000 | -- | |
| Gass Brian E | $56,000 | None Available | |
| Crist Vicki M | $47,000 | None Available |
Source: Public Records
Mortgage History
| Date | Status | Borrower | Loan Amount |
|---|---|---|---|
| Open | Seibert Donald L | $41,800 | |
| Previous Owner | Gass Brian E | $44,800 | |
| Previous Owner | Crist Vicki M | $44,000 |
Source: Public Records
Tax History Compared to Growth
Tax History
| Year | Tax Paid | Tax Assessment Tax Assessment Total Assessment is a certain percentage of the fair market value that is determined by local assessors to be the total taxable value of land and additions on the property. | Land | Improvement |
|---|---|---|---|---|
| 2024 | $1,460 | $23,118 | $4,739 | $18,379 |
| 2023 | $1,299 | $20,641 | $4,231 | $16,410 |
| 2022 | $1,255 | $20,300 | $4,161 | $16,139 |
| 2021 | $1,238 | $18,646 | $3,822 | $14,824 |
| 2020 | $1,219 | $19,319 | $3,960 | $15,359 |
| 2019 | $1,181 | $18,646 | $3,822 | $14,824 |
| 2018 | $1,160 | $18,646 | $3,822 | $14,824 |
| 2017 | $1,156 | $18,646 | $3,822 | $14,824 |
| 2016 | $1,132 | $18,646 | $3,822 | $14,824 |
| 2015 | $1,642 | $18,646 | $3,822 | $14,824 |
| 2014 | $1,642 | $18,646 | $3,822 | $14,824 |
| 2013 | $1,642 | $18,646 | $3,822 | $14,824 |
Source: Public Records
Map
Nearby Homes
- 2720 Champaign Ave
- 3000 Western Ave
- 2713 Moultrie Ave
- 2608 Shelby Ave
- 3216 Western Ave
- 2504 Shelby Ave
- 2509 Moultrie Ave
- 2505 Pine Ave
- 2502 Pine Ave
- 2400 Western Ave
- 3324 Shelby Ave
- 2305 Richmond Ave
- 3105 Marshall Ave
- 2221 Charleston Ave
- 1104 N 32nd St
- 2104 Moultrie Ave
- 1117 N 32nd St
- 3304 Marion Ave
- 801 N 21st St
- 1900 Champaign Ave
- 2905 Richmond Ave
- 2900 Richmond Ave
- 2821 Richmond Ave
- 2909 Richmond Ave
- 2817 Richmond Ave
- 2904 Richmond Ave
- 2913 Richmond Ave
- 2820 Richmond Ave
- 2908 Richmond Ave
- 2813 Richmond Ave
- 2917 Richmond Ave
- 2904 Prairie Ave
- 2908 Prairie Ave
- 2920 Richmond Ave
- 2812 Richmond Ave
- 2809 Richmond Ave
- 2921 Richmond Ave
- 2816 Prairie Ave
- 2912 Prairie Ave
- 2820 Prairie Ave