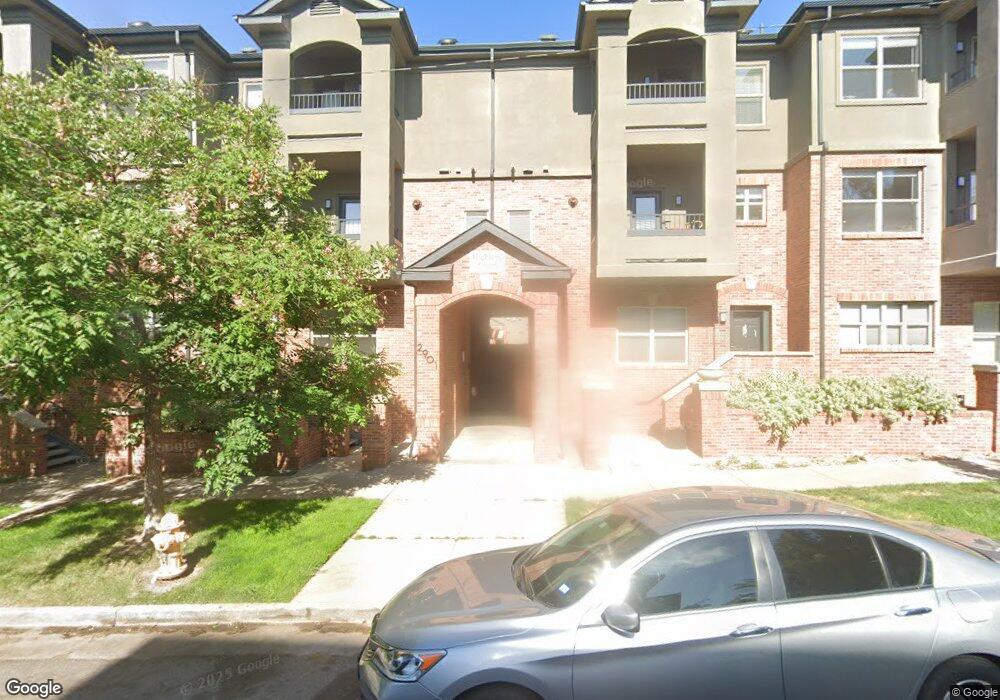
2901 Wyandot St Unit 10 Denver, CO 80211
Highland NeighborhoodEstimated Value: $582,146 - $665,000
2
Beds
3
Baths
1,246
Sq Ft
$503/Sq Ft
Est. Value
About This Home
This home is located at 2901 Wyandot St Unit 10, Denver, CO 80211 and is currently estimated at $626,537, approximately $502 per square foot. 2901 Wyandot St Unit 10 is a home located in Denver County with nearby schools including Bryant Webster Dual Language School, Edison Elementary School, and Denver Montessori Junior/Senior High School.
Ownership History
Date
Name
Owned For
Owner Type
Purchase Details
Closed on
Jun 10, 2010
Sold by
St Romain Joshua P
Bought by
The Joshua P & Laura D St Romain Revocab
Current Estimated Value
Purchase Details
Closed on
Aug 19, 2005
Sold by
Carhart Holly
Bought by
Stromain Joshua P
Home Financials for this Owner
Home Financials are based on the most recent Mortgage that was taken out on this home.
Original Mortgage
$259,538
Interest Rate
5.87%
Mortgage Type
Fannie Mae Freddie Mac
Purchase Details
Closed on
Feb 9, 2001
Sold by
M & R Development Llp
Bought by
Carhart Holly
Home Financials for this Owner
Home Financials are based on the most recent Mortgage that was taken out on this home.
Original Mortgage
$214,650
Interest Rate
7.04%
Create a Home Valuation Report for This Property
The Home Valuation Report is an in-depth analysis detailing your home's value as well as a comparison with similar homes in the area
Home Values in the Area
Average Home Value in this Area
Purchase History
| Date | Buyer | Sale Price | Title Company |
|---|---|---|---|
| The Joshua P & Laura D St Romain Revocab | -- | None Available | |
| Stromain Joshua P | $281,538 | Stewart Title Of Denver | |
| Carhart Holly | $268,300 | First American Heritage Titl |
Source: Public Records
Mortgage History
| Date | Status | Borrower | Loan Amount |
|---|---|---|---|
| Previous Owner | Stromain Joshua P | $259,538 | |
| Previous Owner | Carhart Holly | $214,650 | |
| Closed | Carhart Holly | $26,780 |
Source: Public Records
Tax History Compared to Growth
Tax History
| Year | Tax Paid | Tax Assessment Tax Assessment Total Assessment is a certain percentage of the fair market value that is determined by local assessors to be the total taxable value of land and additions on the property. | Land | Improvement |
|---|---|---|---|---|
| 2024 | $2,994 | $37,800 | $5,570 | $32,230 |
| 2023 | $2,929 | $37,800 | $5,570 | $32,230 |
| 2022 | $2,799 | $35,190 | $8,860 | $26,330 |
| 2021 | $2,702 | $36,210 | $9,120 | $27,090 |
| 2020 | $2,480 | $33,430 | $9,120 | $24,310 |
| 2019 | $2,411 | $33,430 | $9,120 | $24,310 |
| 2018 | $2,447 | $31,630 | $7,650 | $23,980 |
| 2017 | $2,440 | $31,630 | $7,650 | $23,980 |
| 2016 | $2,404 | $29,480 | $8,040 | $21,440 |
| 2015 | $2,303 | $29,480 | $8,040 | $21,440 |
| 2014 | $1,719 | $20,700 | $4,657 | $16,043 |
Source: Public Records
Map
Nearby Homes
- 2900 Wyandot St Unit 101
- 2880 Zuni St Unit 309
- 2880 Zuni St Unit 303
- 2880 Zuni St Unit 404
- 2880 Zuni St Unit 408
- 2880 Zuni St Unit 308
- 2200 W 29th Ave Unit 401
- 2825 Wyandot St
- 3030 Wyandot St Unit 7
- 2460 W 29th Ave Unit 406
- 2460 W 29th Ave Unit 404
- 2441 W Caithness Place
- 1441 Central St Unit 206
- 2480 W Caithness Place Unit 2
- 1555 Central St Unit 306
- 1521 Central St Unit 2D
- 3122 Umatilla St
- 2518 16th St Unit 111
- 2460 W 32nd Ave
- 3211 Zuni St Unit 9
- 2901 Wyandot St Unit 20
- 2901 Wyandot St Unit 19
- 2901 Wyandot St Unit 17
- 2901 Wyandot St Unit 16
- 2901 Wyandot St Unit 15
- 2901 Wyandot St Unit 14
- 2901 Wyandot St Unit 13
- 2901 Wyandot St Unit 12
- 2901 Wyandot St Unit 11
- 2901 Wyandot St Unit 9
- 2901 Wyandot St Unit 8
- 2901 Wyandot St Unit 6
- 2901 Wyandot St Unit 5
- 2901 Wyandot St Unit 4
- 2901 Wyandot St Unit 3
- 2901 Wyandot St Unit 2
- 2901 Wyandot St Unit 1
- 2901 Wyandot St
- 2245 W 29th Ave
- 2300 W 29th Ave