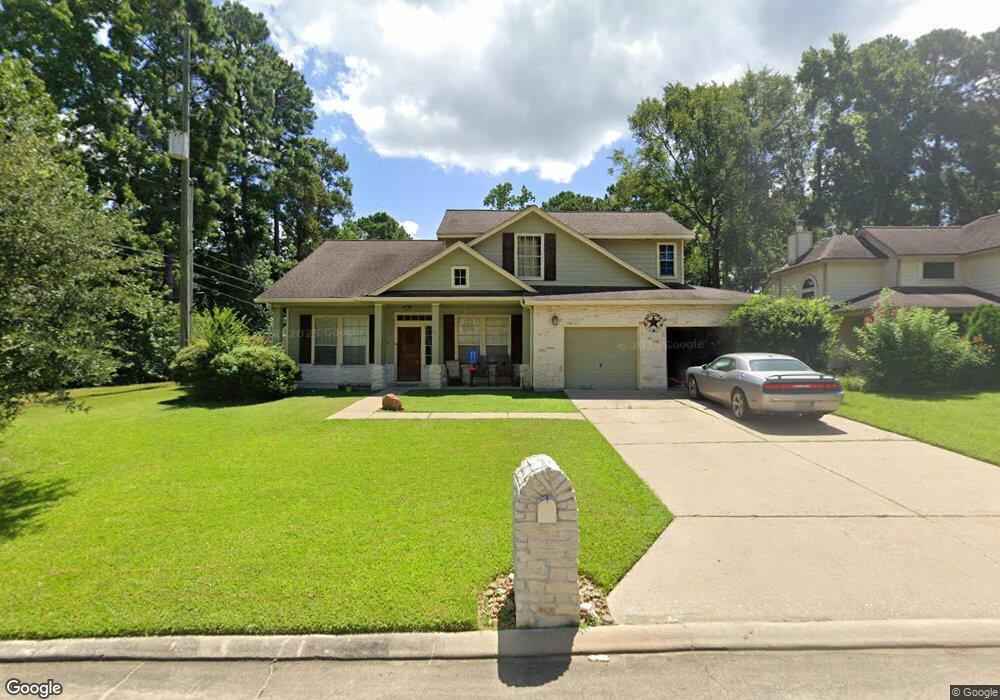
29014 Clearbrook Ln Magnolia, TX 77355
Estimated Value: $324,000 - $420,000
4
Beds
3
Baths
2,703
Sq Ft
$139/Sq Ft
Est. Value
About This Home
This home is located at 29014 Clearbrook Ln, Magnolia, TX 77355 and is currently estimated at $375,064, approximately $138 per square foot. 29014 Clearbrook Ln is a home located in Montgomery County with nearby schools including Nichols Sawmill Elementary School, Magnolia Sixth Grade Campus, and Magnolia Junior High School.
Ownership History
Date
Name
Owned For
Owner Type
Purchase Details
Closed on
Aug 22, 2014
Sold by
Huling Paul S and Huling Jeaneen L
Bought by
Carey Patrick and Carey Laura
Current Estimated Value
Home Financials for this Owner
Home Financials are based on the most recent Mortgage that was taken out on this home.
Original Mortgage
$195,742
Outstanding Balance
$149,041
Interest Rate
4.15%
Mortgage Type
VA
Estimated Equity
$226,023
Purchase Details
Closed on
Nov 10, 1999
Sold by
Emmite Fred S and Emmite Candace A
Bought by
Huling Paul S and Huling Jeaneen L
Home Financials for this Owner
Home Financials are based on the most recent Mortgage that was taken out on this home.
Original Mortgage
$130,400
Interest Rate
7.83%
Purchase Details
Closed on
Aug 14, 1998
Sold by
Royce Homes Inc
Bought by
Carey Patrick and Carey Laura
Create a Home Valuation Report for This Property
The Home Valuation Report is an in-depth analysis detailing your home's value as well as a comparison with similar homes in the area
Home Values in the Area
Average Home Value in this Area
Purchase History
| Date | Buyer | Sale Price | Title Company |
|---|---|---|---|
| Carey Patrick | -- | First American Title | |
| Huling Paul S | -- | -- | |
| Carey Patrick | -- | -- |
Source: Public Records
Mortgage History
| Date | Status | Borrower | Loan Amount |
|---|---|---|---|
| Open | Carey Patrick | $195,742 | |
| Previous Owner | Huling Paul S | $130,400 |
Source: Public Records
Tax History Compared to Growth
Tax History
| Year | Tax Paid | Tax Assessment Tax Assessment Total Assessment is a certain percentage of the fair market value that is determined by local assessors to be the total taxable value of land and additions on the property. | Land | Improvement |
|---|---|---|---|---|
| 2025 | $7,838 | $350,773 | $58,000 | $292,773 |
| 2024 | $3,832 | $354,926 | -- | -- |
| 2023 | $3,832 | $322,660 | $58,000 | $295,910 |
| 2022 | $8,461 | $293,330 | $58,000 | $265,320 |
| 2021 | $7,943 | $266,660 | $41,480 | $225,180 |
| 2020 | $8,315 | $257,150 | $41,480 | $215,670 |
| 2019 | $7,109 | $220,500 | $41,480 | $179,020 |
| 2018 | $6,962 | $209,440 | $41,480 | $167,960 |
| 2017 | $7,060 | $209,460 | $41,480 | $167,980 |
| 2016 | $6,899 | $204,690 | $12,900 | $191,790 |
| 2015 | $5,501 | $200,750 | $12,900 | $187,850 |
| 2014 | $5,501 | $168,330 | $12,900 | $157,530 |
Source: Public Records
Map
Nearby Homes
- 28915 Pine Forest Dr
- 28915 Forest Hill Dr
- 42 Brookefield Cir
- TBD Legacy Ct
- 59 Beaconsfield Dr
- 29010 Legacy Ct
- 0 Country Place Unit 33111380
- 19803 Ruby Terrace Ln
- 18903 Veterans Rd
- 28418 Teal Ct
- 28046 Crossway Oaks
- 28028 Crossway Oaks
- 29924 Nichols Sawmills
- 16715 Frosted Evergreen Ct
- 18919 S Sapling Oaks Place
- TBD Fm 1774 Rd
- 18915 Veterans Rd
- 20210 Ruby Terrace Ln
- 30119 Saw Oaks Dr
- 30106 Saw Oaks Dr
- 29010 Clearbrook Ln
- 29006 Clearbrook Ln
- 29015 Ashbrook Ln
- 19120 Cloverwood Dr
- 29011 Ashbrook Ln
- 29002 Clearbrook Ln
- 29007 Ashbrook Ln
- 29011 Clearbrook Ln
- 29003 Ashbrook Ln
- 29007 Clearbrook Ln
- 28926 Clearbrook Ln
- 29003 Clearbrook Ln
- 28927 Ashbrook Ln
- 28922 Clearbrook Ln
- 28927 Clearbrook Ln
- 29006 Ashbrook Ln
- 28923 Ashbrook Ln
- 29014 Ashbrook Ln
- 29010 Ashbrook Ln
- 29006 Ashbrook Ln