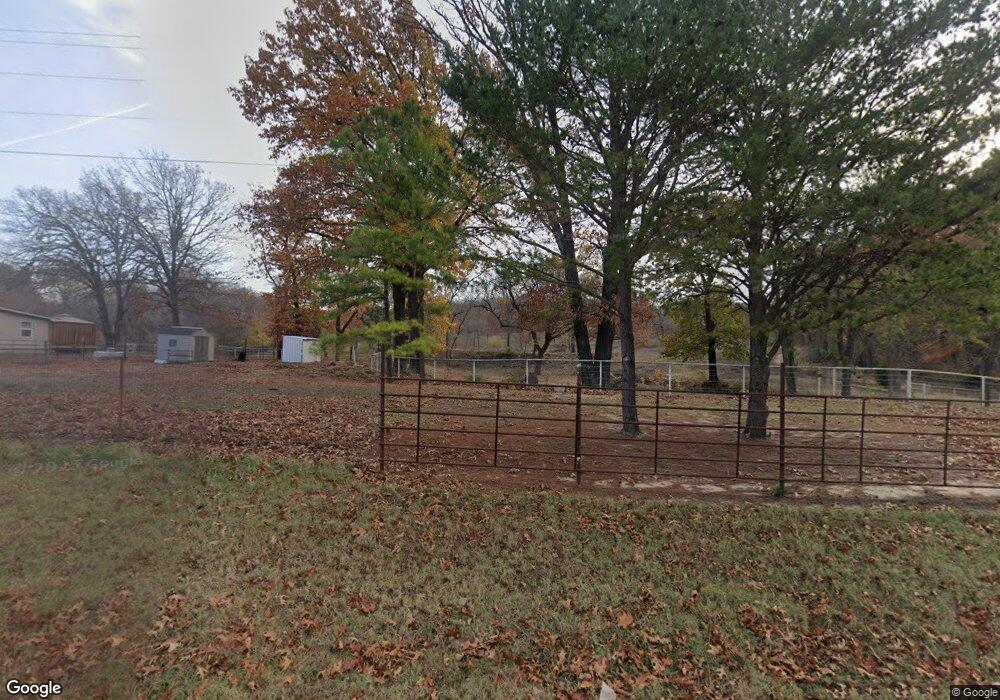
29019 S 321st West Ave Bristow, OK 74010
Estimated Value: $261,000 - $300,074
3
Beds
2
Baths
2,000
Sq Ft
$140/Sq Ft
Est. Value
About This Home
This home is located at 29019 S 321st West Ave, Bristow, OK 74010 and is currently estimated at $280,519, approximately $140 per square foot. 29019 S 321st West Ave is a home located in Creek County with nearby schools including Edison Elementary School, Collins Elementary School, and Bristow Middle School.
Ownership History
Date
Name
Owned For
Owner Type
Purchase Details
Closed on
Aug 23, 2016
Sold by
Mcneill Justin and Mcneill Angie
Bought by
Buck Marvin Randolph and Buck Sandra J
Current Estimated Value
Home Financials for this Owner
Home Financials are based on the most recent Mortgage that was taken out on this home.
Original Mortgage
$168,332
Outstanding Balance
$134,049
Interest Rate
3.42%
Mortgage Type
VA
Estimated Equity
$146,470
Purchase Details
Closed on
Sep 17, 2008
Sold by
Gordon Dustin
Bought by
Smith Amy
Home Financials for this Owner
Home Financials are based on the most recent Mortgage that was taken out on this home.
Original Mortgage
$124,325
Interest Rate
6.6%
Mortgage Type
FHA
Purchase Details
Closed on
Aug 4, 2008
Sold by
Smith Jason D and Smith Amy M
Bought by
Mcneill Justin
Home Financials for this Owner
Home Financials are based on the most recent Mortgage that was taken out on this home.
Original Mortgage
$124,325
Interest Rate
6.6%
Mortgage Type
FHA
Purchase Details
Closed on
May 18, 2004
Sold by
Whitehouse Sharon and Whitehouse Wilbe
Purchase Details
Closed on
Mar 7, 2001
Sold by
Whitehouse Mathew and Whitehouse Robin
Create a Home Valuation Report for This Property
The Home Valuation Report is an in-depth analysis detailing your home's value as well as a comparison with similar homes in the area
Home Values in the Area
Average Home Value in this Area
Purchase History
| Date | Buyer | Sale Price | Title Company |
|---|---|---|---|
| Buck Marvin Randolph | $155,000 | None Available | |
| Smith Amy | $125,000 | None Available | |
| Mcneill Justin | $150,000 | None Available | |
| -- | $1,500 | -- | |
| -- | $60,500 | -- |
Source: Public Records
Mortgage History
| Date | Status | Borrower | Loan Amount |
|---|---|---|---|
| Open | Buck Marvin Randolph | $168,332 | |
| Previous Owner | Smith Amy | $124,325 | |
| Previous Owner | Mcneill Justin | $147,682 |
Source: Public Records
Tax History Compared to Growth
Tax History
| Year | Tax Paid | Tax Assessment Tax Assessment Total Assessment is a certain percentage of the fair market value that is determined by local assessors to be the total taxable value of land and additions on the property. | Land | Improvement |
|---|---|---|---|---|
| 2024 | $1,989 | $21,231 | $4,317 | $16,914 |
| 2023 | $1,989 | $20,612 | $4,317 | $16,295 |
| 2022 | $1,817 | $20,012 | $4,317 | $15,695 |
| 2021 | $1,769 | $19,429 | $4,317 | $15,112 |
| 2020 | $1,740 | $19,787 | $3,563 | $16,224 |
| 2019 | $1,701 | $19,211 | $3,321 | $15,890 |
| 2018 | $1,692 | $18,652 | $1,721 | $16,931 |
| 2017 | $1,698 | $18,652 | $1,721 | $16,931 |
| 2016 | $1,709 | $17,526 | $3,408 | $14,118 |
| 2015 | -- | $17,526 | $3,408 | $14,118 |
| 2014 | -- | $17,043 | $3,156 | $13,887 |
Source: Public Records
Map
Nearby Homes
- 29110 S 321st West Ave
- 1293 Timberwood St
- 34698 W 301st St S
- 0000 S 369th West Ave
- 35444 W 271st St S
- 35525 W 271st St S
- 32528 W 261st St S
- 26412 S 341st West Ave
- 29775 S 369th West Ave
- 33820 W 261st St S
- 33805 W 261st St S
- 24975 S 305th West Ave
- 4 Sunflower St
- 6 Sunflower St
- 2 Sunflower St
- 00000 281st St
- 24354 State Highway 48
- 1602 S Hickory St
- 1421 S Cedar St
- 20 Bluebell St
- 28890 S 321st West Ave
- 28801 S 321st West Ave
- 28644 S 321st West Ave
- 28655 S 321st West Ave
- 28600 S 321st West Ave
- 28898 S 321st West Ave
- 28535 S 321st West Ave
- 29455 S 321st West Ave
- 29570 S 321st West Ave
- 28456 S 321st West Ave
- 28394 S 321st West Ave
- 29630 S 321st West Ave
- 28345 S 321st West Ave
- 33211 S 321st West Ave
- 0 S 321st West Ave
- 29110 S 321st Ave W
- 33211 S 321st Ave W
- 28320 S 321st West Ave
- 28265 S 321st West Ave
- 29830 S 321st West Ave