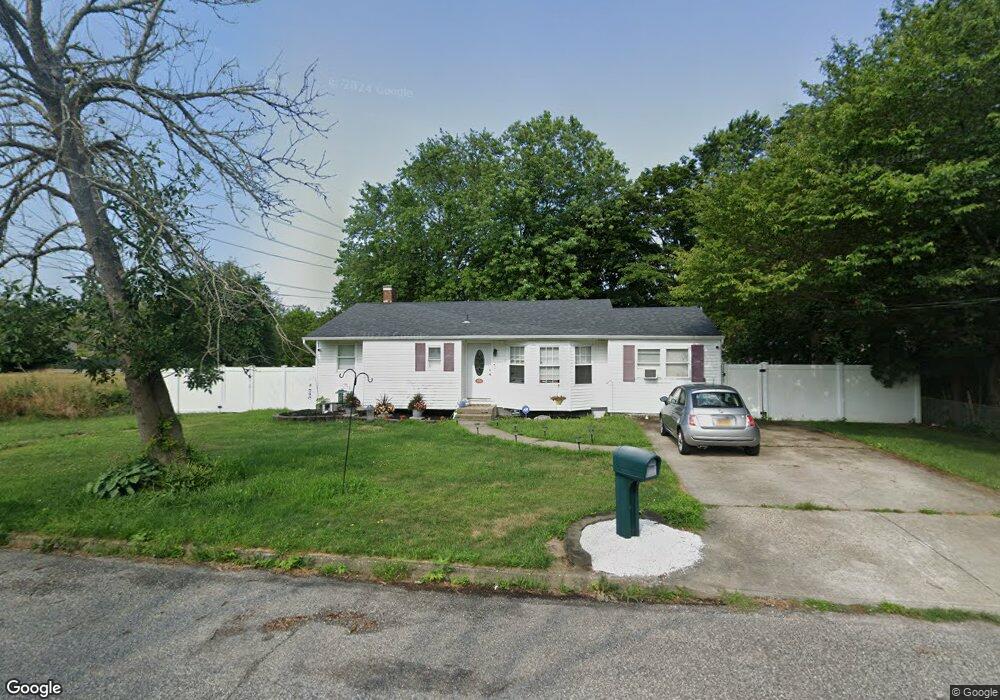
2902 Devon Ave Medford, NY 11763
Estimated Value: $500,000 - $560,000
4
Beds
2
Baths
1,106
Sq Ft
$474/Sq Ft
Est. Value
About This Home
This home is located at 2902 Devon Ave, Medford, NY 11763 and is currently estimated at $524,781, approximately $474 per square foot. 2902 Devon Ave is a home located in Suffolk County with nearby schools including Patchogue-Medford High School and Long Island Baptist Academy.
Ownership History
Date
Name
Owned For
Owner Type
Purchase Details
Closed on
Mar 30, 2018
Sold by
Aaa Constr Contractng & Dev
Bought by
Alvarez Christopher and Alvarez Debora
Current Estimated Value
Purchase Details
Closed on
Jun 7, 2016
Sold by
Gmat Legal Trust 2013 1
Bought by
Aaa Construction Contracting And Develop
Purchase Details
Closed on
Jun 29, 2015
Sold by
Spiess James G and Ahmed Shamser Ali Nisa
Bought by
Gmat Legal Title Trust 2013 1
Purchase Details
Closed on
Mar 21, 2008
Purchase Details
Closed on
Dec 13, 2005
Sold by
Gulick Susan
Bought by
Ahmed Nisa
Purchase Details
Closed on
Jul 23, 2001
Sold by
Gulick Edward
Bought by
Gulick Edward and Gulick Susan
Home Financials for this Owner
Home Financials are based on the most recent Mortgage that was taken out on this home.
Original Mortgage
$128,000
Interest Rate
7.99%
Create a Home Valuation Report for This Property
The Home Valuation Report is an in-depth analysis detailing your home's value as well as a comparison with similar homes in the area
Home Values in the Area
Average Home Value in this Area
Purchase History
| Date | Buyer | Sale Price | Title Company |
|---|---|---|---|
| Alvarez Christopher | -- | -- | |
| Aaa Construction Contracting And Develop | $152,608 | Zodiac Title Services Llc | |
| Gmat Legal Title Trust 2013 1 | $170,000 | None Available | |
| -- | -- | -- | |
| Ahmed Nisa | $280,000 | Yael Lazar | |
| Gulick Edward | -- | Fidelity National Title Ins |
Source: Public Records
Mortgage History
| Date | Status | Borrower | Loan Amount |
|---|---|---|---|
| Previous Owner | Gulick Edward | $128,000 |
Source: Public Records
Tax History Compared to Growth
Tax History
| Year | Tax Paid | Tax Assessment Tax Assessment Total Assessment is a certain percentage of the fair market value that is determined by local assessors to be the total taxable value of land and additions on the property. | Land | Improvement |
|---|---|---|---|---|
| 2024 | $10,147 | $2,315 | $160 | $2,155 |
| 2023 | $10,147 | $2,315 | $160 | $2,155 |
| 2022 | $9,091 | $2,315 | $160 | $2,155 |
| 2021 | $9,091 | $2,315 | $160 | $2,155 |
| 2020 | $9,332 | $2,315 | $160 | $2,155 |
| 2019 | $9,332 | $0 | $0 | $0 |
| 2018 | $8,383 | $2,315 | $160 | $2,155 |
| 2017 | $8,383 | $2,200 | $160 | $2,040 |
| 2016 | $8,218 | $2,200 | $160 | $2,040 |
| 2015 | -- | $2,200 | $160 | $2,040 |
| 2014 | -- | $2,200 | $160 | $2,040 |
Source: Public Records
Map
Nearby Homes
- 1902 Phillips Dr
- 1902 Race Ave
- 3004 New London Ave
- 2905 Beechnut Ave
- 0 Cedar Ln Unit ONE3556748
- 2909 Falcon Ave
- 0 Sipp Ave Unit KEY830779
- 2812 Sipp Ave
- 1300 Race Ave
- 1301 Race Ave
- 2816 Acorn Ave
- 2401 Race Ave
- 3106 Devon Ave
- 3115 Chestnut Ave
- 1600 Fire Ave
- 3110 Kane Ave
- 2405 Fire Ave
- 2617 Kane Ave
- 3115 Heather Ave
- 2697 Heather Ave
- 2904 Devon Ave
- 2903 New London Ave
- 2905 New London Ave
- 2903 Devon Ave
- 2906 Devon Ave
- 2905 Devon Ave
- 2907 New London Ave
- 2907 Devon Ave
- 1903 Phillips Dr
- 2908 Devon Ave
- 1905 Phillips Dr
- 1901 Phillips Dr
- 2902 Watchill Ave
- 2909 New London Ave
- 2904 Watchill Ave
- 2902 New London Ave
- 2909 Devon Ave
- 1907 Phillips Dr
- 2904 New London Ave
- 2906 Watchill Ave