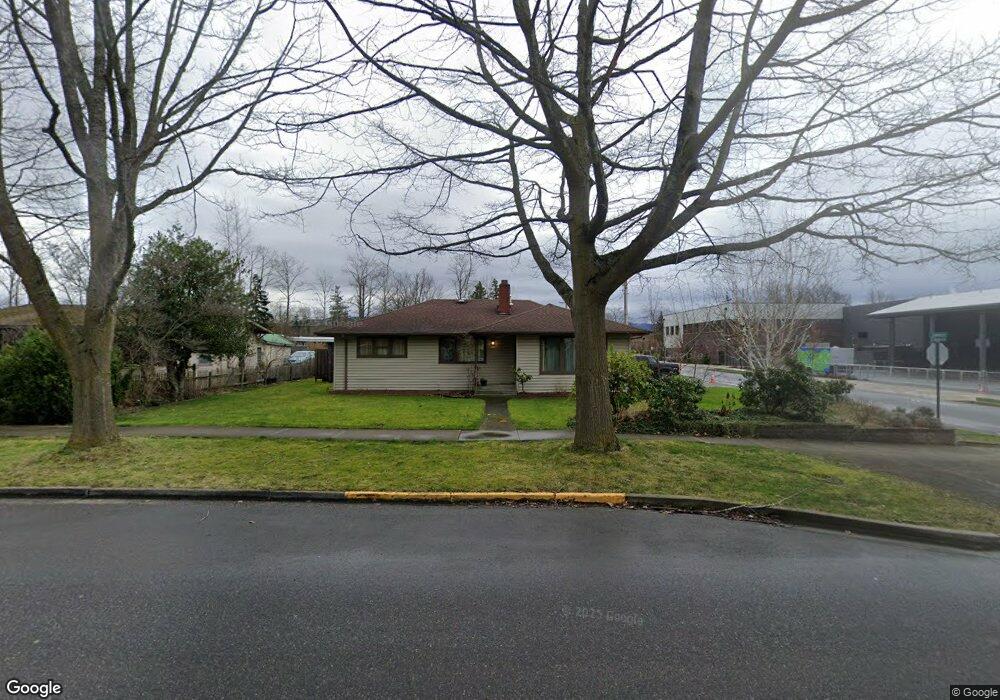
2902 James St Bellingham, WA 98225
Sunnyland NeighborhoodEstimated Value: $545,000 - $689,000
3
Beds
1
Bath
1,182
Sq Ft
$505/Sq Ft
Est. Value
About This Home
This home is located at 2902 James St, Bellingham, WA 98225 and is currently estimated at $596,866, approximately $504 per square foot. 2902 James St is a home located in Whatcom County with nearby schools including Sunnyland Elementary School, Whatcom Middle School, and Bellingham High School.
Ownership History
Date
Name
Owned For
Owner Type
Purchase Details
Closed on
Jan 8, 2003
Sold by
Miller David M and Miller Kathy L
Bought by
Sanders Alex J
Current Estimated Value
Home Financials for this Owner
Home Financials are based on the most recent Mortgage that was taken out on this home.
Original Mortgage
$127,900
Outstanding Balance
$49,496
Interest Rate
4.75%
Estimated Equity
$547,370
Create a Home Valuation Report for This Property
The Home Valuation Report is an in-depth analysis detailing your home's value as well as a comparison with similar homes in the area
Home Values in the Area
Average Home Value in this Area
Purchase History
| Date | Buyer | Sale Price | Title Company |
|---|---|---|---|
| Sanders Alex J | $159,900 | Chicago Title Insurance |
Source: Public Records
Mortgage History
| Date | Status | Borrower | Loan Amount |
|---|---|---|---|
| Open | Sanders Alex J | $127,900 | |
| Closed | Sanders Alex J | $32,000 |
Source: Public Records
Tax History Compared to Growth
Tax History
| Year | Tax Paid | Tax Assessment Tax Assessment Total Assessment is a certain percentage of the fair market value that is determined by local assessors to be the total taxable value of land and additions on the property. | Land | Improvement |
|---|---|---|---|---|
| 2024 | $4,293 | $537,826 | $246,304 | $291,522 |
| 2023 | $4,293 | $551,487 | $252,560 | $298,927 |
| 2022 | $3,505 | $475,428 | $217,728 | $257,700 |
| 2021 | $3,438 | $377,324 | $172,800 | $204,524 |
| 2020 | $3,323 | $349,374 | $160,000 | $189,374 |
| 2019 | $2,975 | $326,373 | $149,733 | $176,640 |
| 2018 | $2,996 | $292,973 | $134,433 | $158,540 |
| 2017 | $2,583 | $252,240 | $115,740 | $136,500 |
| 2016 | $2,261 | $227,263 | $103,860 | $123,403 |
| 2015 | $2,217 | $207,084 | $94,860 | $112,224 |
| 2014 | -- | $196,474 | $90,000 | $106,474 |
| 2013 | -- | $202,895 | $92,400 | $110,495 |
Source: Public Records
Map
Nearby Homes
- 607 E Illinois St
- 2929 Nevada St
- 2627 Iron St
- 3020 E North St
- 3024 E North St
- 2430 Ellis St
- 1714 Sunup Loop
- 1716 Sunup Loop
- 1712 Sunup Loop
- 1737 Sunup Loop
- 1735 Sunup Loop
- 1733 Sunup Loop
- 2500 Cornwall Ave
- 2716 Sunset Dr
- 214 Carolina St
- 2873 Undine St
- 1812 E Maryland St
- 1813 Undine Ln
- 2518 S Park Dr
- 804 Gilbert Dr