Estimated Value: $200,000 - $258,000
3
Beds
2
Baths
1,154
Sq Ft
$195/Sq Ft
Est. Value
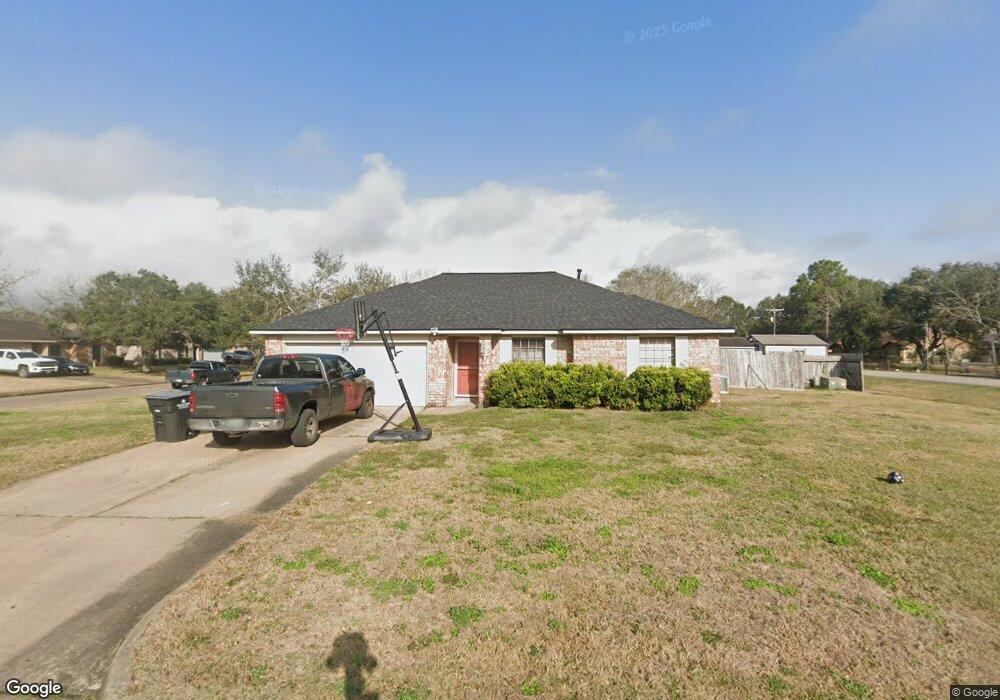
About This Home
This home is located at 2902 Quail Run Dr, Alvin, TX 77511 and is currently estimated at $225,519, approximately $195 per square foot. 2902 Quail Run Dr is a home located in Brazoria County with nearby schools including Bob & Betty Nelson Elementary School, Alvin Junior High School, and Alvin High School.
Ownership History
Date
Name
Owned For
Owner Type
Purchase Details
Closed on
May 21, 2025
Sold by
Vargas Kimberly
Bought by
Salinas John Travis and Noyola-Hernandez Yenifer
Current Estimated Value
Home Financials for this Owner
Home Financials are based on the most recent Mortgage that was taken out on this home.
Original Mortgage
$7,364
Interest Rate
6.62%
Purchase Details
Closed on
Aug 9, 2016
Sold by
Davenport Kaysie Michelle and Braak Kaysie M
Bought by
Vargas Kimberly
Purchase Details
Closed on
Nov 19, 2010
Sold by
Braak Paul Ray
Bought by
Braak Kaysie Michelle
Purchase Details
Closed on
Dec 2, 2008
Sold by
Post Maryanne H
Bought by
Braak Kaysie M and Braak Paul R
Home Financials for this Owner
Home Financials are based on the most recent Mortgage that was taken out on this home.
Original Mortgage
$105,826
Interest Rate
5.99%
Mortgage Type
FHA
Create a Home Valuation Report for This Property
The Home Valuation Report is an in-depth analysis detailing your home's value as well as a comparison with similar homes in the area
Home Values in the Area
Average Home Value in this Area
Purchase History
| Date | Buyer | Sale Price | Title Company |
|---|---|---|---|
| Salinas John Travis | -- | Texas American Title Company | |
| Vargas Kimberly | -- | None Available | |
| Braak Kaysie Michelle | -- | None Available | |
| Braak Kaysie M | -- | Stewart Title Company |
Source: Public Records
Mortgage History
| Date | Status | Borrower | Loan Amount |
|---|---|---|---|
| Closed | Salinas John Travis | $7,364 | |
| Open | Salinas John Travis | $147,283 | |
| Previous Owner | Braak Kaysie M | $105,826 | |
| Closed | Braak Kaysie Michelle | $0 |
Source: Public Records
Tax History Compared to Growth
Tax History
| Year | Tax Paid | Tax Assessment Tax Assessment Total Assessment is a certain percentage of the fair market value that is determined by local assessors to be the total taxable value of land and additions on the property. | Land | Improvement |
|---|---|---|---|---|
| 2025 | $4,512 | $181,130 | $22,820 | $158,310 |
| 2023 | $4,512 | $187,920 | $22,820 | $165,100 |
| 2022 | $4,885 | $178,080 | $22,820 | $155,260 |
| 2021 | $4,531 | $156,960 | $27,380 | $129,580 |
| 2020 | $4,511 | $154,140 | $21,060 | $133,080 |
| 2019 | $3,889 | $129,480 | $17,550 | $111,930 |
| 2018 | $3,811 | $126,650 | $17,550 | $109,100 |
| 2017 | $3,449 | $113,190 | $17,550 | $95,640 |
| 2016 | $3,200 | $105,000 | $17,550 | $87,450 |
| 2015 | $2,948 | $100,910 | $17,550 | $83,360 |
| 2014 | $2,948 | $107,590 | $17,550 | $90,040 |
Source: Public Records
Map
Nearby Homes
- 3206 Deer Trail Dr
- 2609 Quail Run Dr
- 3401 Wood Fox Dr
- 221 Magnolia Laurel Dr
- 239 Bay Laurel Ct
- 211 Orchard Laurel Dr
- 220 Magnolia Laurel Dr
- 204 Orchard Laurel Dr
- 243 Bay Laurel Ct
- 230 Magnolia Laurel Dr
- 1916 Tracy Lynn Ln
- 2609 Adams St
- 2604 Adams St
- 2514 Westfield St
- 2408 Chelmsford Ct
- 2714 Westfield St
- 1902 Westview Dr
- 2306 Westfield St
- 00 Davis Bend County Rd 179 Rd
- 000 Corner of County Road 180 and County Road 181 Rd
- 2808 Dove Tree Dr
- 2806 Dove Tree Dr
- 2901 Quail Run Dr
- 2903 Quail Run Dr
- 3002 Quail Run Dr
- 2807 Dove Tree Dr
- 2905 Quail Run Dr
- 2804 Dove Tree Dr
- 2745 Rowan Burton Rd
- 2725 Rowan Burton Rd Unit 178
- 2805 Dove Tree Dr
- 3001 Quail Run Dr
- 2802 Dove Tree Dr
- 2803 Dove Tree Dr
- 3003 Quail Run Dr
- 2810 Mockingbird Dr
- 2808 Mockingbird Dr
- 2801 Dove Tree Dr
- 2806 Mockingbird Dr
- 2710 Dove Tree Dr