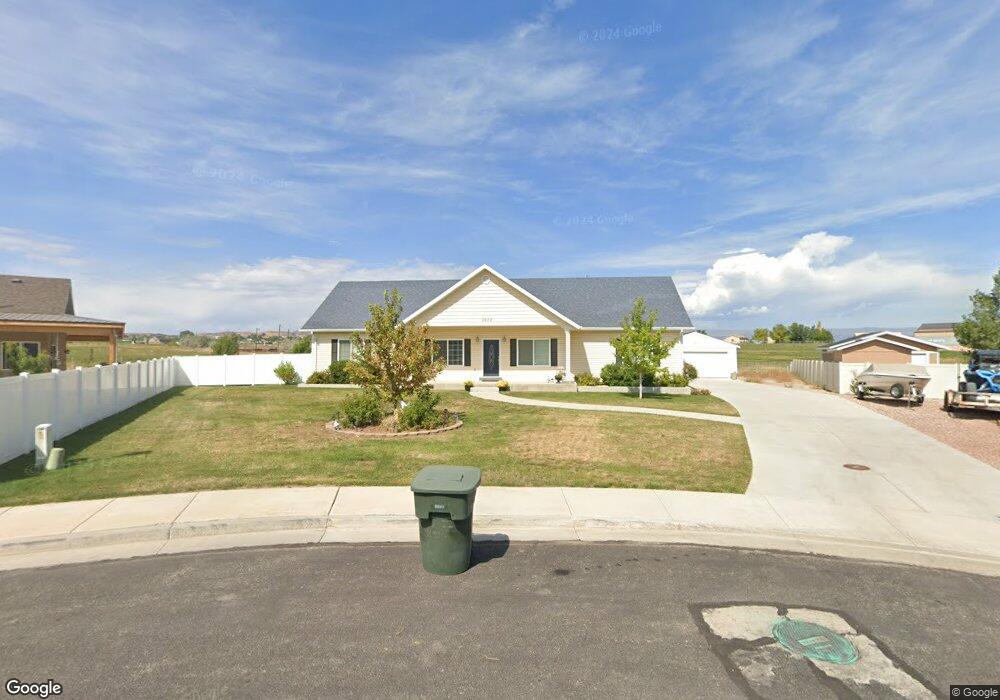
2902 S 290 E Vernal, UT 84078
Estimated Value: $464,000
4
Beds
3
Baths
2,586
Sq Ft
$179/Sq Ft
Est. Value
About This Home
This home is located at 2902 S 290 E, Vernal, UT 84078 and is currently priced at $464,000, approximately $179 per square foot. 2902 S 290 E is a home located in Uintah County with nearby schools including Davis School, Vernal Middle School, and Uintah Middle School.
Ownership History
Date
Name
Owned For
Owner Type
Purchase Details
Closed on
Jul 29, 2010
Sold by
Cook Devin R
Bought by
Cook Devin R and Cook Felicia
Current Estimated Value
Purchase Details
Closed on
May 20, 2009
Sold by
Cabrinha Erlene K
Bought by
Erlene Luka Lahapa Cabrinha Living Trust
Purchase Details
Closed on
Apr 17, 2009
Sold by
Ophir Queen Mines A Utah A Corp
Bought by
Cmh Homes Inc
Purchase Details
Closed on
Sep 2, 2008
Sold by
Morgan Nick
Bought by
Mines Ophir Queen
Purchase Details
Closed on
Feb 22, 2008
Sold by
Baxter Construction Inc
Bought by
Morgan Nick
Purchase Details
Closed on
Nov 20, 2007
Sold by
M & M Financial Group Llc
Bought by
Baxter Construction Inc
Purchase Details
Closed on
Feb 22, 2007
Sold by
Brown Ivan Wade
Bought by
Strategic Development Inc
Purchase Details
Closed on
Feb 1, 2007
Sold by
Strategic Development Inc
Bought by
M & M Financial Group Llc
Create a Home Valuation Report for This Property
The Home Valuation Report is an in-depth analysis detailing your home's value as well as a comparison with similar homes in the area
Purchase History
| Date | Buyer | Sale Price | Title Company |
|---|---|---|---|
| Cook Devin R | -- | -- | |
| Cook Devin R | -- | -- | |
| Erlene Luka Lahapa Cabrinha Living Trust | -- | -- | |
| Cmh Homes Inc | -- | -- | |
| Mines Ophir Queen | -- | -- | |
| Morgan Nick | -- | -- | |
| Baxter Construction Inc | -- | -- | |
| Strategic Development Inc | -- | -- | |
| M & M Financial Group Llc | -- | -- |
Source: Public Records
Tax History
| Year | Tax Paid | Tax Assessment Tax Assessment Total Assessment is a certain percentage of the fair market value that is determined by local assessors to be the total taxable value of land and additions on the property. | Land | Improvement |
|---|---|---|---|---|
| 2024 | $2,078 | $233,776 | $20,749 | $213,027 |
| 2023 | $2,024 | $219,840 | $20,749 | $199,091 |
| 2022 | $1,916 | $180,021 | $20,749 | $159,272 |
| 2021 | $1,979 | $153,476 | $20,749 | $132,727 |
| 2020 | $1,876 | $149,279 | $16,500 | $132,779 |
| 2019 | $1,899 | $149,279 | $16,500 | $132,779 |
| 2018 | $1,658 | $130,527 | $16,500 | $114,027 |
| 2017 | $16 | $130,527 | $16,500 | $114,027 |
| 2016 | $1,554 | $134,053 | $16,500 | $117,553 |
| 2015 | $1,452 | $135,604 | $16,500 | $119,104 |
| 2014 | $1,366 | $128,862 | $16,500 | $112,362 |
| 2013 | $1,394 | $128,862 | $16,500 | $112,362 |
Source: Public Records
Map
Nearby Homes
- 2902 S 290 E Unit 14
- 303 E 2900 S Unit 13
- 303 E 2900 S
- 2916 S 290 E Unit 15
- 2916 S 290 E
- 2934 S 290 E Unit 16
- 2934 S 290 E
- 317 E 2900 S Unit 12
- 317 E 2900 S
- 304 E 2900 S Unit 40
- 304 E 2900 S
- 318 E 2900 S
- 318 E 2900 S Unit 41
- 333 E 2900 S Unit 11
- 333 E 2900 S
- 2952 S 290 E Unit 17
- 2952 S 290 E
- 305 E 2970 S Unit 39
- 334 E 2900 S Unit 42
- 334 E 2900 S
Your Personal Tour Guide
Ask me questions while you tour the home.