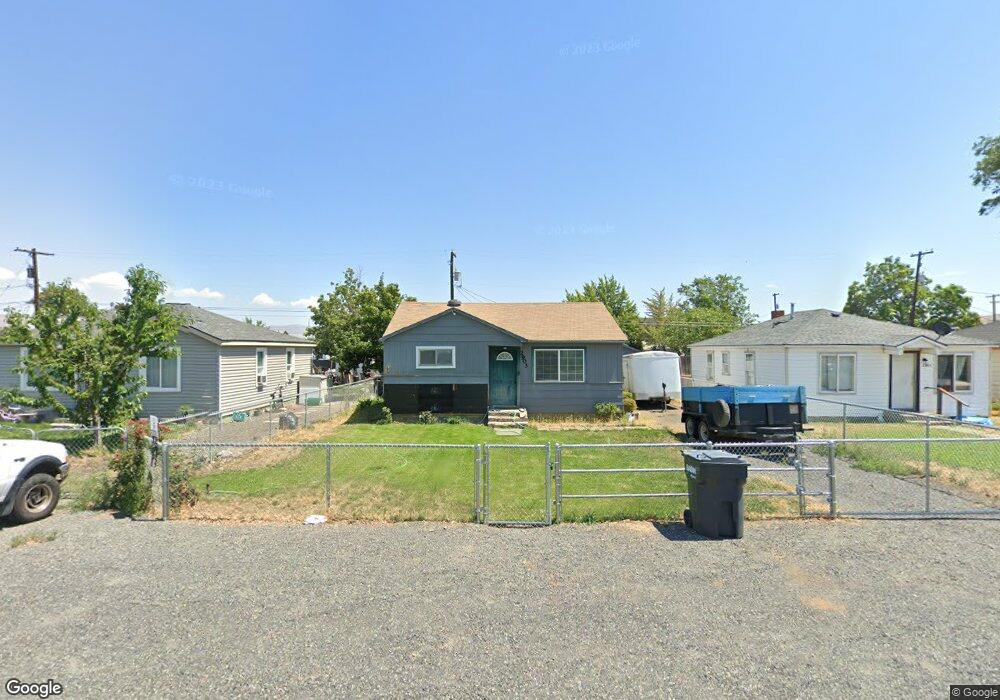
2903 2nd St Union Gap, WA 98903
Estimated Value: $282,000 - $329,000
3
Beds
1
Bath
1,096
Sq Ft
$270/Sq Ft
Est. Value
About This Home
This home is located at 2903 2nd St, Union Gap, WA 98903 and is currently estimated at $295,519, approximately $269 per square foot. 2903 2nd St is a home located in Yakima County with nearby schools including Union Gap School, Grace Lutheran School, and La Salle High School.
Ownership History
Date
Name
Owned For
Owner Type
Purchase Details
Closed on
Aug 15, 2023
Sold by
Kilbury Brett
Bought by
Torres Rosa Marisol and Silva Jose Alberto
Current Estimated Value
Home Financials for this Owner
Home Financials are based on the most recent Mortgage that was taken out on this home.
Original Mortgage
$279,837
Outstanding Balance
$271,929
Interest Rate
6.71%
Mortgage Type
FHA
Estimated Equity
$23,590
Purchase Details
Closed on
Dec 30, 2009
Sold by
Flores Araceli
Bought by
Kilbury Brett
Home Financials for this Owner
Home Financials are based on the most recent Mortgage that was taken out on this home.
Original Mortgage
$109,971
Interest Rate
4.78%
Mortgage Type
FHA
Purchase Details
Closed on
Sep 15, 2004
Sold by
Rowley Shannon Reed and Rowley Shari L
Bought by
Flores Araceli
Home Financials for this Owner
Home Financials are based on the most recent Mortgage that was taken out on this home.
Original Mortgage
$89,200
Interest Rate
5.76%
Mortgage Type
Purchase Money Mortgage
Create a Home Valuation Report for This Property
The Home Valuation Report is an in-depth analysis detailing your home's value as well as a comparison with similar homes in the area
Home Values in the Area
Average Home Value in this Area
Purchase History
| Date | Buyer | Sale Price | Title Company |
|---|---|---|---|
| Torres Rosa Marisol | $285,000 | First American Title | |
| Kilbury Brett | $112,000 | Pacific Alliance Title Co | |
| Flores Araceli | $89,200 | Pacific Alliance Title Co |
Source: Public Records
Mortgage History
| Date | Status | Borrower | Loan Amount |
|---|---|---|---|
| Open | Torres Rosa Marisol | $279,837 | |
| Closed | Torres Rosa Marisol | $10,934 | |
| Previous Owner | Kilbury Brett | $109,971 | |
| Previous Owner | Flores Araceli | $89,200 |
Source: Public Records
Tax History
| Year | Tax Paid | Tax Assessment Tax Assessment Total Assessment is a certain percentage of the fair market value that is determined by local assessors to be the total taxable value of land and additions on the property. | Land | Improvement |
|---|---|---|---|---|
| 2025 | $1,953 | $240,800 | $31,600 | $209,200 |
| 2023 | $1,470 | $144,900 | $24,800 | $120,100 |
| 2022 | $1,382 | $135,600 | $24,800 | $110,800 |
| 2021 | $1,282 | $119,300 | $24,800 | $94,500 |
| 2019 | $1,031 | $102,600 | $24,800 | $77,800 |
| 2018 | $997 | $88,600 | $24,800 | $63,800 |
| 2017 | $929 | $87,500 | $24,800 | $62,700 |
| 2016 | $1,114 | $87,100 | $24,800 | $62,300 |
| 2015 | $1,114 | $88,000 | $24,800 | $63,200 |
| 2014 | $1,114 | $88,000 | $24,800 | $63,200 |
| 2013 | $1,114 | $88,000 | $24,800 | $63,200 |
Source: Public Records
Map
Nearby Homes
- 2810 S 2nd St
- 2907 S 3rd St
- 403 W Ahtanum Rd
- 500 Richards Rd
- 408 W Pine St Unit 30
- 3609 3rd St
- 102 E California St Unit 6
- NKA Ahtanum Ridge Dr Unit 5
- 1236 Ahtanum Ridge Dr Unit 12
- 1236 Ahtanum Ridge Dr Unit 11
- 18 W Washington Ave Unit 23
- 18 W Washington Ave Unit 142
- 18 W Washington Ave Unit 24
- 18 W Washington Ave Unit 27
- 4207 Main St
- 2007 Longfibre Rd
- 1904 Mcnair Ave
- 2709 Riverside Rd
- 0 Goodman Rd
- 53 & 55 Samantha Ct
Your Personal Tour Guide
Ask me questions while you tour the home.