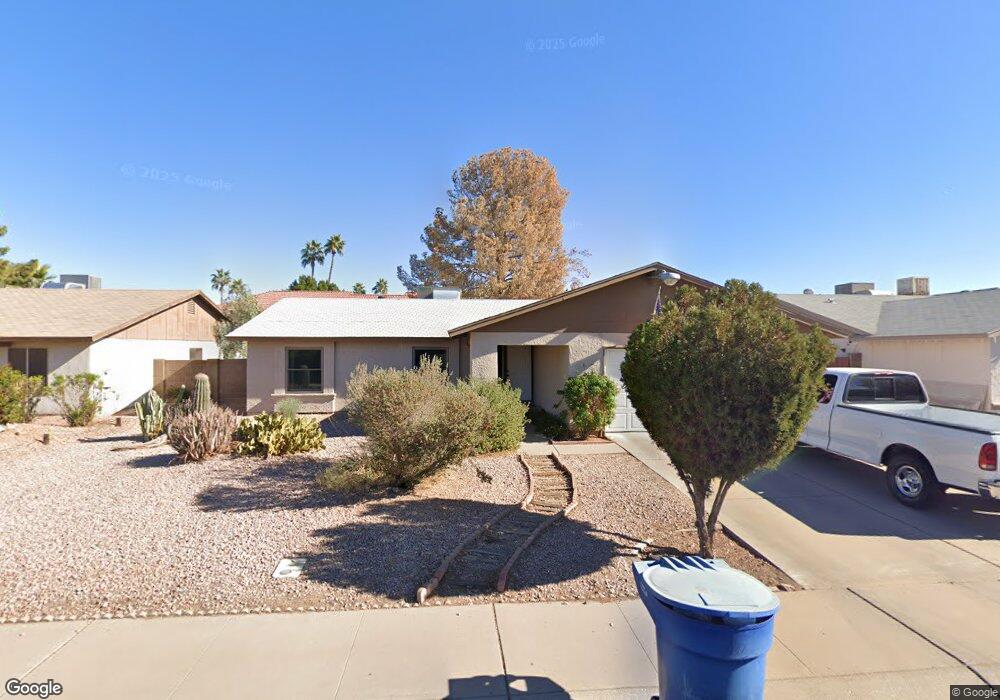
2903 N Dakota St Chandler, AZ 85225
Amberwood NeighborhoodEstimated Value: $354,681 - $502,000
--
Bed
2
Baths
1,622
Sq Ft
$270/Sq Ft
Est. Value
About This Home
This home is located at 2903 N Dakota St, Chandler, AZ 85225 and is currently estimated at $437,170, approximately $269 per square foot. 2903 N Dakota St is a home located in Maricopa County with nearby schools including Sirrine Elementary School, Franklin at Brimhall Elementary School, and Summit Academy Elementary.
Ownership History
Date
Name
Owned For
Owner Type
Purchase Details
Closed on
Dec 23, 2014
Sold by
Collins Gerald L and Gale Collins Merrilee G
Bought by
Collins Gerald L and Gale Gollins Merrilee G
Current Estimated Value
Home Financials for this Owner
Home Financials are based on the most recent Mortgage that was taken out on this home.
Original Mortgage
$253,500
Outstanding Balance
$186,686
Interest Rate
2.91%
Mortgage Type
Reverse Mortgage Home Equity Conversion Mortgage
Estimated Equity
$250,484
Purchase Details
Closed on
Oct 23, 1995
Sold by
Altstock Christopher Edward and Altstock Peggy Kay
Bought by
Collins Gerald L and Gale Collins Merrilee
Home Financials for this Owner
Home Financials are based on the most recent Mortgage that was taken out on this home.
Original Mortgage
$96,900
Interest Rate
7.58%
Mortgage Type
VA
Create a Home Valuation Report for This Property
The Home Valuation Report is an in-depth analysis detailing your home's value as well as a comparison with similar homes in the area
Home Values in the Area
Average Home Value in this Area
Purchase History
| Date | Buyer | Sale Price | Title Company |
|---|---|---|---|
| Collins Gerald L | -- | Placer Title Company | |
| Collins Gerald L | $95,000 | Chicago Title Insurance Co |
Source: Public Records
Mortgage History
| Date | Status | Borrower | Loan Amount |
|---|---|---|---|
| Open | Collins Gerald L | $253,500 | |
| Closed | Collins Gerald L | $96,900 |
Source: Public Records
Tax History Compared to Growth
Tax History
| Year | Tax Paid | Tax Assessment Tax Assessment Total Assessment is a certain percentage of the fair market value that is determined by local assessors to be the total taxable value of land and additions on the property. | Land | Improvement |
|---|---|---|---|---|
| 2025 | $1,446 | $16,951 | -- | -- |
| 2024 | $1,459 | $16,144 | -- | -- |
| 2023 | $1,459 | $32,620 | $6,520 | $26,100 |
| 2022 | $1,419 | $24,350 | $4,870 | $19,480 |
| 2021 | $1,427 | $22,530 | $4,500 | $18,030 |
| 2020 | $1,411 | $20,710 | $4,140 | $16,570 |
| 2019 | $1,300 | $19,050 | $3,810 | $15,240 |
| 2018 | $1,262 | $17,400 | $3,480 | $13,920 |
| 2017 | $1,214 | $16,110 | $3,220 | $12,890 |
| 2016 | $1,187 | $15,520 | $3,100 | $12,420 |
| 2015 | $1,117 | $13,920 | $2,780 | $11,140 |
Source: Public Records
Map
Nearby Homes
- 2970 N Oregon St Unit 10
- 2986 N Oregon St Unit 7
- 2954 N Oregon St Unit 6
- 2940 N Oregon St Unit 9
- 400 W Crofton St
- 305 W Nopal Place
- 286 W Palomino Dr Unit 147
- 286 W Palomino Dr Unit 99
- 286 W Palomino Dr Unit 75
- 286 W Palomino Dr Unit 85
- 3401 N Dakota St
- 617 W Chilton St
- 3491 N Arizona Ave Unit 138
- 800 W Marlboro Dr
- 307 W El Prado Rd
- 2712 N Evergreen St
- 3139 S Date Cir
- 535 W Pantera Ave
- 3009 N Pleasant Dr
- 537 W Posada Ave
- 2901 N Dakota St
- 2905 N Dakota St
- 2970 N Oregon St Unit 1
- 2970 N Oregon St Unit 11
- 2970 N Oregon St Unit 16
- 2970 N Oregon St Unit 4
- 2970 N Oregon St Unit 7
- 2970 N Oregon St Unit 12
- 2970 N Oregon St Unit 15
- 2970 N Oregon St Unit 9
- 2970 N Oregon St Unit 8
- 2970 N Oregon St Unit 3
- 2970 N Oregon St Unit 14
- 2970 N Oregon St Unit 13
- 2970 N Oregon St Unit 5
- 2970 N Oregon St Unit 6
- 2970 N Oregon St
- 2807 N Dakota St Unit 2
- 300 W Marlboro Dr
- 2907 N Dakota St