Estimated Value: $215,276 - $255,000
3
Beds
2
Baths
1,240
Sq Ft
$189/Sq Ft
Est. Value
About This Home
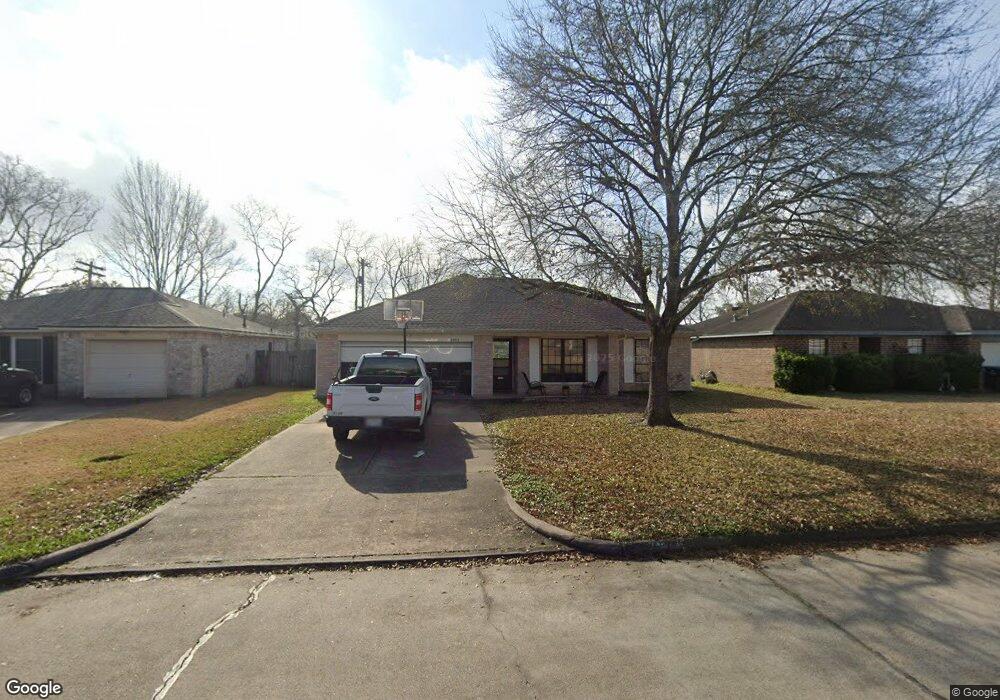
This home is located at 2903 Quail Run Dr, Alvin, TX 77511 and is currently estimated at $234,569, approximately $189 per square foot. 2903 Quail Run Dr is a home located in Brazoria County with nearby schools including Bob & Betty Nelson Elementary School, Alvin Junior High School, and Alvin High School.
Ownership History
Date
Name
Owned For
Owner Type
Purchase Details
Closed on
Apr 28, 2016
Sold by
Rivera Charles and Rivera Amber L
Bought by
Gutierrez Daniel and Gutierrez Daisy
Current Estimated Value
Home Financials for this Owner
Home Financials are based on the most recent Mortgage that was taken out on this home.
Original Mortgage
$133,482
Outstanding Balance
$108,256
Interest Rate
4.25%
Mortgage Type
FHA
Estimated Equity
$126,313
Purchase Details
Closed on
Feb 27, 2009
Sold by
Vaughn Betty Jane and Lee Donna Lynn
Bought by
Christian Nancy Jane
Purchase Details
Closed on
Jan 5, 2003
Sold by
Highberg Lord Haywood and Highberg Annie Louise
Bought by
Vaughn Betty Jane and Lee Donna Lynn
Purchase Details
Closed on
Oct 20, 2000
Sold by
Bruggman Shirley D
Bought by
Highberg Lord Haywood and Highberg Annie Louise
Create a Home Valuation Report for This Property
The Home Valuation Report is an in-depth analysis detailing your home's value as well as a comparison with similar homes in the area
Home Values in the Area
Average Home Value in this Area
Purchase History
| Date | Buyer | Sale Price | Title Company |
|---|---|---|---|
| Gutierrez Daniel | -- | None Available | |
| Christian Nancy Jane | -- | Alamo Title 4 | |
| Vaughn Betty Jane | -- | -- | |
| Highberg Lord Haywood | -- | Commerce Land Title |
Source: Public Records
Mortgage History
| Date | Status | Borrower | Loan Amount |
|---|---|---|---|
| Open | Gutierrez Daniel | $133,482 |
Source: Public Records
Tax History Compared to Growth
Tax History
| Year | Tax Paid | Tax Assessment Tax Assessment Total Assessment is a certain percentage of the fair market value that is determined by local assessors to be the total taxable value of land and additions on the property. | Land | Improvement |
|---|---|---|---|---|
| 2025 | $3,036 | $186,020 | $18,250 | $167,770 |
| 2023 | $3,036 | $192,475 | $18,250 | $175,000 |
| 2022 | $4,800 | $174,977 | $18,250 | $164,460 |
| 2021 | $4,592 | $159,070 | $21,900 | $137,170 |
| 2020 | $4,478 | $153,000 | $16,850 | $136,150 |
| 2019 | $3,982 | $132,580 | $14,040 | $118,540 |
| 2018 | $3,899 | $129,570 | $14,040 | $115,530 |
| 2017 | $3,512 | $115,240 | $14,040 | $101,200 |
| 2016 | $3,391 | $111,280 | $14,040 | $97,240 |
| 2015 | $2,905 | $112,490 | $14,040 | $98,450 |
| 2014 | $2,905 | $106,130 | $14,040 | $92,090 |
Source: Public Records
Map
Nearby Homes
- 3206 Deer Trail Dr
- 2609 Quail Run Dr
- 221 Magnolia Laurel Dr
- 239 Bay Laurel Ct
- 211 Orchard Laurel Dr
- 220 Magnolia Laurel Dr
- 204 Orchard Laurel Dr
- 243 Bay Laurel Ct
- 230 Magnolia Laurel Dr
- 3401 Wood Fox Dr
- 1916 Tracy Lynn Ln
- 2609 Adams St
- 2604 Adams St
- 2514 Westfield St
- 2408 Chelmsford Ct
- 1902 Westview Dr
- 2714 Westfield St
- 2306 Westfield St
- 00 Davis Bend County Rd 179 Rd
- 000 Corner of County Road 180 and County Road 181 Rd
- 2905 Quail Run Dr
- 2901 Quail Run Dr
- 3001 Quail Run Dr
- 2902 Quail Run Dr
- 3003 Quail Run Dr
- 3002 Quail Run Dr
- 2926 Rowan Burton Rd
- 2808 Dove Tree Dr
- 2745 Rowan Burton Rd
- 2725 Rowan Burton Rd Unit 178
- 2807 Dove Tree Dr
- 2810 Mockingbird Dr
- 2806 Dove Tree Dr
- 3007 Quail Run Dr
- 2925 Rowan Burton Rd
- 2805 Dove Tree Dr
- 2808 Mockingbird Dr
- 2960 Rowan Burton Rd
- 2804 Dove Tree Dr
- 3101 Quail Run Dr