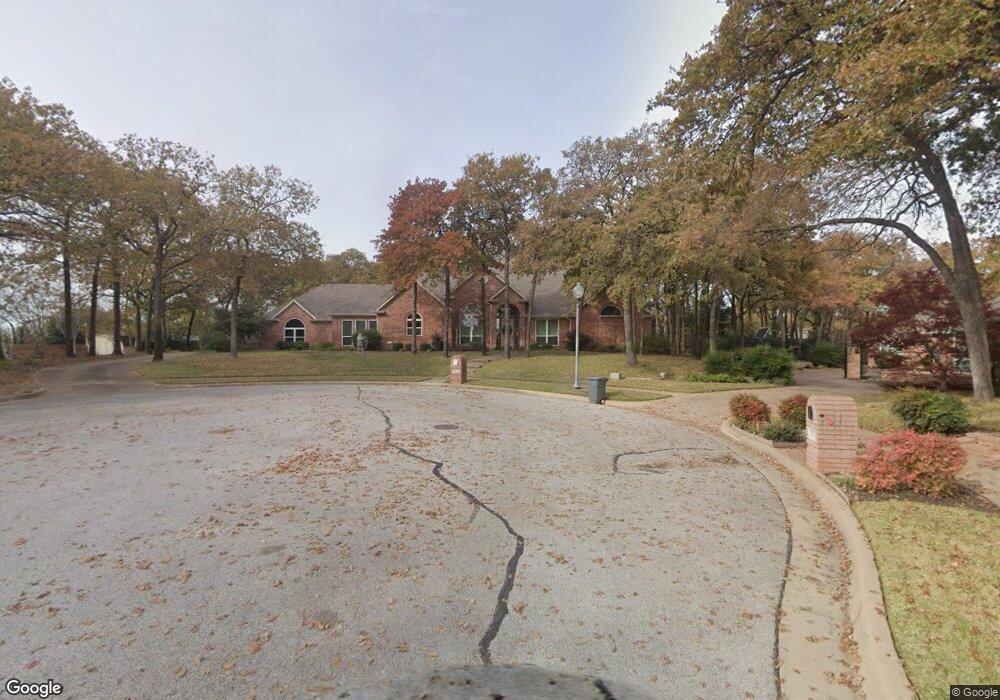
2904 Bristol Glen Southlake, TX 76092
Estimated Value: $902,000 - $1,120,000
4
Beds
3
Baths
3,502
Sq Ft
$282/Sq Ft
Est. Value
About This Home
This home is located at 2904 Bristol Glen, Southlake, TX 76092 and is currently estimated at $987,851, approximately $282 per square foot. 2904 Bristol Glen is a home located in Tarrant County with nearby schools including Florence Elementary School, Bear Creek Intermediate School, and Keller Middle School.
Ownership History
Date
Name
Owned For
Owner Type
Purchase Details
Closed on
Aug 13, 2007
Sold by
Cox James Earl and Cox Susan Boyd
Bought by
Cox James Earl and Cox Susan Boyd
Current Estimated Value
Purchase Details
Closed on
Jul 3, 1996
Sold by
Grb Construction Inc
Bought by
Cox James E and Cox Susan B
Home Financials for this Owner
Home Financials are based on the most recent Mortgage that was taken out on this home.
Original Mortgage
$155,000
Interest Rate
8.05%
Mortgage Type
Balloon
Purchase Details
Closed on
Apr 5, 1996
Sold by
Ridgewood/Southlake Joint Venture
Bought by
Grb Construction Inc
Home Financials for this Owner
Home Financials are based on the most recent Mortgage that was taken out on this home.
Original Mortgage
$208,000
Interest Rate
7.42%
Mortgage Type
Construction
Create a Home Valuation Report for This Property
The Home Valuation Report is an in-depth analysis detailing your home's value as well as a comparison with similar homes in the area
Home Values in the Area
Average Home Value in this Area
Purchase History
| Date | Buyer | Sale Price | Title Company |
|---|---|---|---|
| Cox James Earl | -- | None Available | |
| Cox James E | -- | Commonwealth Land Title | |
| Grb Construction Inc | -- | Commonwealth Land Title |
Source: Public Records
Mortgage History
| Date | Status | Borrower | Loan Amount |
|---|---|---|---|
| Closed | Cox James E | $155,000 | |
| Previous Owner | Grb Construction Inc | $208,000 |
Source: Public Records
Tax History Compared to Growth
Tax History
| Year | Tax Paid | Tax Assessment Tax Assessment Total Assessment is a certain percentage of the fair market value that is determined by local assessors to be the total taxable value of land and additions on the property. | Land | Improvement |
|---|---|---|---|---|
| 2025 | $3,956 | $951,539 | $200,000 | $751,539 |
| 2024 | $3,956 | $951,539 | $200,000 | $751,539 |
| 2023 | $13,455 | $955,267 | $200,000 | $755,267 |
| 2022 | $14,180 | $759,705 | $110,000 | $649,705 |
| 2021 | $13,921 | $582,903 | $110,000 | $472,903 |
| 2020 | $14,086 | $585,214 | $110,000 | $475,214 |
| 2019 | $13,733 | $538,237 | $110,000 | $428,237 |
| 2018 | $6,931 | $529,206 | $110,000 | $419,206 |
| 2017 | $12,550 | $501,191 | $110,000 | $391,191 |
| 2016 | $11,409 | $497,931 | $110,000 | $387,931 |
| 2015 | $6,803 | $397,600 | $60,000 | $337,600 |
| 2014 | $6,803 | $397,600 | $60,000 | $337,600 |
Source: Public Records
Map
Nearby Homes
- 600 Overland Trail
- 605 Royal Ln
- 700 Overland Trail
- 3095 Johnson Rd
- 146 Jellico Cir
- 2912 Sutton Place
- 2655 Johnson Rd
- 404 Branding Iron Ct
- 3210 Gray Ln
- 127 Jellico Cir
- 275 Timberline Ln
- 605 Castleman Ct
- 2740 W Southlake Blvd
- 2021 Vista Rd
- 1920 Pearson Crossing
- 2608 W Southlake Blvd
- 2304 Top Rail Ln
- 112 Stony Brook Way
- 2004 Vista View Rd
- Maverick Plan at Winding Creek
- 2902 Bristol Glen
- 300 Timber Trail
- 608 Overland Trail
- 604 Overland Trail
- 2905 Yorkshire Ct
- 612 Overland Trail
- 2903 Bristol Glen
- 2903 Bristol Glen Ct
- 2900 Bristol Glen
- 2903 Yorkshire Ct
- 616 Overland Trail
- 2906 Yorkshire Ct
- 2901 Bristol Glen
- 2901 Yorkshire Ct
- 609 Overland Trail
- 605 Overland Trail
- 613 Overland Trail
- 601 Overland Trail
- 620 Overland Trail
- 2904 Yorkshire Ct