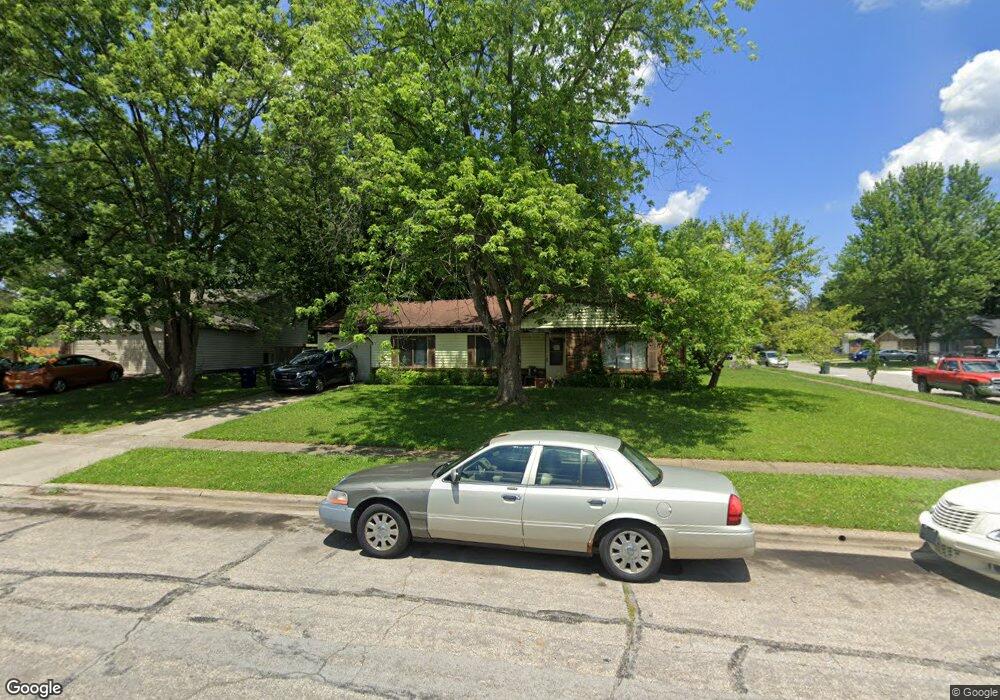
2904 Chimney Point Dr Columbus, OH 43231
Brandywine NeighborhoodEstimated Value: $225,000 - $305,000
3
Beds
2
Baths
1,280
Sq Ft
$208/Sq Ft
Est. Value
About This Home
This home is located at 2904 Chimney Point Dr, Columbus, OH 43231 and is currently estimated at $266,369, approximately $208 per square foot. 2904 Chimney Point Dr is a home located in Franklin County with nearby schools including Mark Twain Elementary School, Walnut Springs Middle School, and Westerville South High School.
Ownership History
Date
Name
Owned For
Owner Type
Purchase Details
Closed on
Jul 1, 2025
Sold by
Oxenham Samantha M
Bought by
Zanotto Janos B
Current Estimated Value
Purchase Details
Closed on
Sep 28, 2007
Sold by
Wells Fargo Bank Na
Bought by
Smith Christopher Floyd
Home Financials for this Owner
Home Financials are based on the most recent Mortgage that was taken out on this home.
Original Mortgage
$86,400
Interest Rate
6.5%
Mortgage Type
VA
Purchase Details
Closed on
Mar 27, 2007
Sold by
Brown Andrea and Walls Andrea D
Bought by
Wells Fargo Bank Na
Purchase Details
Closed on
Nov 7, 2006
Sold by
Harris Ethel Marie
Bought by
Harris Shawn D
Purchase Details
Closed on
Oct 23, 1999
Sold by
Raffel Suzanne V and Mink Suzanne V
Bought by
Walls Andrea D
Home Financials for this Owner
Home Financials are based on the most recent Mortgage that was taken out on this home.
Original Mortgage
$80,711
Interest Rate
7.87%
Mortgage Type
Stand Alone First
Purchase Details
Closed on
Aug 24, 1993
Bought by
Raffel Suzanne
Purchase Details
Closed on
Oct 1, 1983
Create a Home Valuation Report for This Property
The Home Valuation Report is an in-depth analysis detailing your home's value as well as a comparison with similar homes in the area
Home Values in the Area
Average Home Value in this Area
Purchase History
| Date | Buyer | Sale Price | Title Company |
|---|---|---|---|
| Zanotto Janos B | -- | Columbus Title | |
| Smith Christopher Floyd | $96,000 | Sovereign | |
| Wells Fargo Bank Na | $78,000 | None Available | |
| Harris Shawn D | -- | Attorney | |
| Walls Andrea D | $87,000 | -- | |
| Raffel Suzanne | $74,000 | -- | |
| -- | $49,600 | -- |
Source: Public Records
Mortgage History
| Date | Status | Borrower | Loan Amount |
|---|---|---|---|
| Previous Owner | Smith Christopher Floyd | $86,400 | |
| Previous Owner | Walls Andrea D | $80,711 |
Source: Public Records
Tax History
| Year | Tax Paid | Tax Assessment Tax Assessment Total Assessment is a certain percentage of the fair market value that is determined by local assessors to be the total taxable value of land and additions on the property. | Land | Improvement |
|---|---|---|---|---|
| 2025 | $3,845 | $72,390 | $19,850 | $52,540 |
| 2024 | $3,845 | $72,390 | $19,850 | $52,540 |
| 2023 | $3,074 | $72,380 | $19,845 | $52,535 |
| 2022 | $2,440 | $47,050 | $14,670 | $32,380 |
| 2021 | $2,464 | $47,050 | $14,670 | $32,380 |
| 2020 | $2,456 | $47,050 | $14,670 | $32,380 |
| 2019 | $1,941 | $37,630 | $11,730 | $25,900 |
| 2018 | $1,879 | $37,630 | $11,730 | $25,900 |
| 2017 | $1,902 | $37,630 | $11,730 | $25,900 |
| 2016 | $1,858 | $34,480 | $8,820 | $25,660 |
| 2015 | $1,862 | $34,480 | $8,820 | $25,660 |
| 2014 | $1,863 | $34,480 | $8,820 | $25,660 |
| 2013 | $994 | $36,295 | $9,275 | $27,020 |
Source: Public Records
Map
Nearby Homes
- 4660 Glenhaven Dr
- 2903 Kilbourne Ave
- 3001 Bretton Woods Dr
- 2912 Ironstone Dr
- 2901 Footloose Dr
- 2902 Footloose Dr
- 3069 Wallingford Ave
- 4560 Stonehedge Rd
- 0 Chester Rd
- 0 Abington Rd Unit 225045775
- 0 Abington Rd Unit 224031704
- 0 Abington Rd Unit 224031738
- 0 Abington Rd Unit 224031699
- 0 Abington Rd Unit 225045777
- 2669 Alder Vista Dr
- 2618 Clybourne Rd
- 3169 Yellow Finch Way
- 3313 Trail Lane Ct
- 2601 Brooklyn Rd
- 3309 Parklane Ave
- 4723 Lowery Dr
- 4723 Lowrey Dr
- 2896 Chimney Point Dr
- 4731 Lowery Dr
- 4731 Lowrey Dr
- 2888 Chimney Point Dr
- 2907 Chimney Point Dr
- 2928 Chimney Point Dr
- 4720 Lowrey Dr
- 4720 Lowery Dr
- 2915 Chimney Point Dr
- 4728 Lowrey Dr
- 2891 Chimney Point Dr
- 4728 Lowery Dr
- 2880 Chimney Point Dr
- 4738 Clipper Ct
- 2923 Chimney Point Dr
- 4739 Lowery Dr
- 2895 Blarefield Dr
- 4736 Lowrey Dr
Your Personal Tour Guide
Ask me questions while you tour the home.