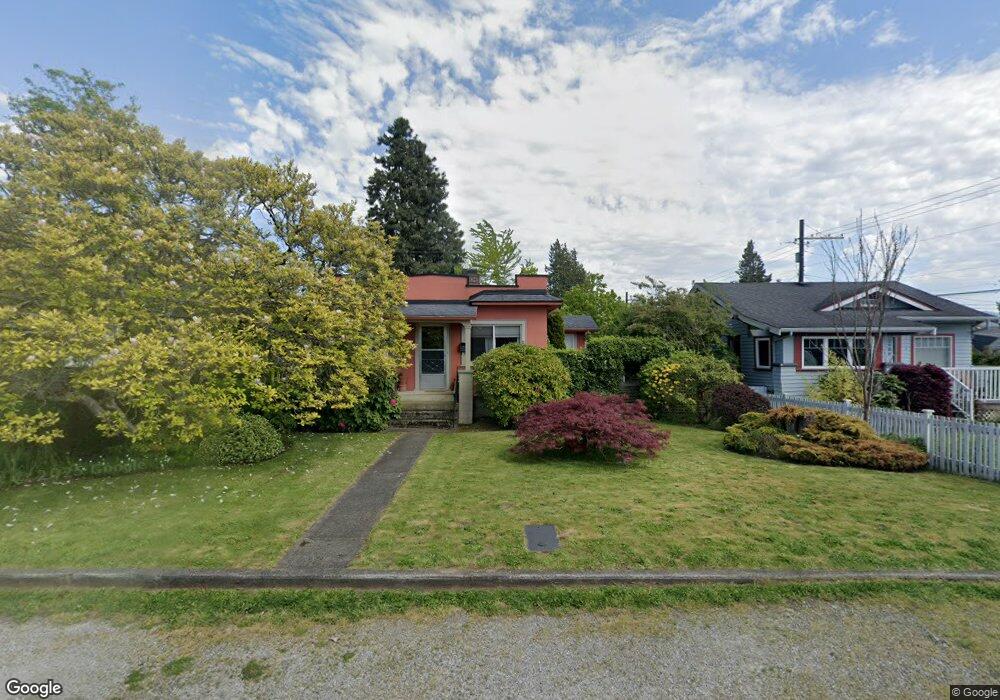
2904 Elm St Bellingham, WA 98225
Columbia NeighborhoodEstimated Value: $516,000 - $566,000
1
Bed
1
Bath
816
Sq Ft
$661/Sq Ft
Est. Value
About This Home
This home is located at 2904 Elm St, Bellingham, WA 98225 and is currently estimated at $538,993, approximately $660 per square foot. 2904 Elm St is a home located in Whatcom County with nearby schools including Parkview Elementary School, Whatcom Middle School, and Bellingham High School.
Ownership History
Date
Name
Owned For
Owner Type
Purchase Details
Closed on
Feb 26, 2001
Sold by
Sofie Elaine
Bought by
Bisset Audra
Current Estimated Value
Home Financials for this Owner
Home Financials are based on the most recent Mortgage that was taken out on this home.
Original Mortgage
$76,900
Outstanding Balance
$28,190
Interest Rate
7.11%
Estimated Equity
$510,803
Create a Home Valuation Report for This Property
The Home Valuation Report is an in-depth analysis detailing your home's value as well as a comparison with similar homes in the area
Home Values in the Area
Average Home Value in this Area
Purchase History
| Date | Buyer | Sale Price | Title Company |
|---|---|---|---|
| Bisset Audra | $99,900 | First American Title Ins |
Source: Public Records
Mortgage History
| Date | Status | Borrower | Loan Amount |
|---|---|---|---|
| Open | Bisset Audra | $76,900 |
Source: Public Records
Tax History Compared to Growth
Tax History
| Year | Tax Paid | Tax Assessment Tax Assessment Total Assessment is a certain percentage of the fair market value that is determined by local assessors to be the total taxable value of land and additions on the property. | Land | Improvement |
|---|---|---|---|---|
| 2024 | $125 | $511,575 | $246,304 | $265,271 |
| 2023 | $125 | $524,569 | $252,560 | $272,009 |
| 2022 | $154 | $452,222 | $217,728 | $57,790 |
| 2021 | $168 | $358,907 | $172,800 | $57,790 |
| 2020 | $175 | $332,321 | $160,000 | $172,321 |
| 2019 | $536 | $312,020 | $136,423 | $175,597 |
| 2018 | $197 | $280,086 | $122,483 | $157,603 |
| 2017 | $208 | $241,145 | $105,452 | $135,693 |
| 2016 | $207 | $217,302 | $94,628 | $122,674 |
| 2015 | $216 | $197,989 | $86,428 | $111,561 |
| 2014 | -- | $187,845 | $82,000 | $105,845 |
| 2013 | -- | $174,719 | $73,500 | $101,219 |
Source: Public Records
Map
Nearby Homes
- 3018 Elm St
- 3008 Meridian St
- 2805 Walnut St
- 2600 Elm St
- 2500 Meridian St
- 1508 E Maplewood Ave
- 1800 J St
- 3000 Firwood Ave
- 2500 Cornwall Ave
- 2218 Jaeger St
- 1410 J St
- 1315 Astor St
- 1200 W Holly St
- 3330 Northwest Ave
- 2715 W Maplewood Ave Unit 122
- 3350 Northwest Ave Unit 1102
- 2019 Cornwall Ave
- 2432 Grant St
- 2829 Cottonwood Ave
- 2111 Franklin St