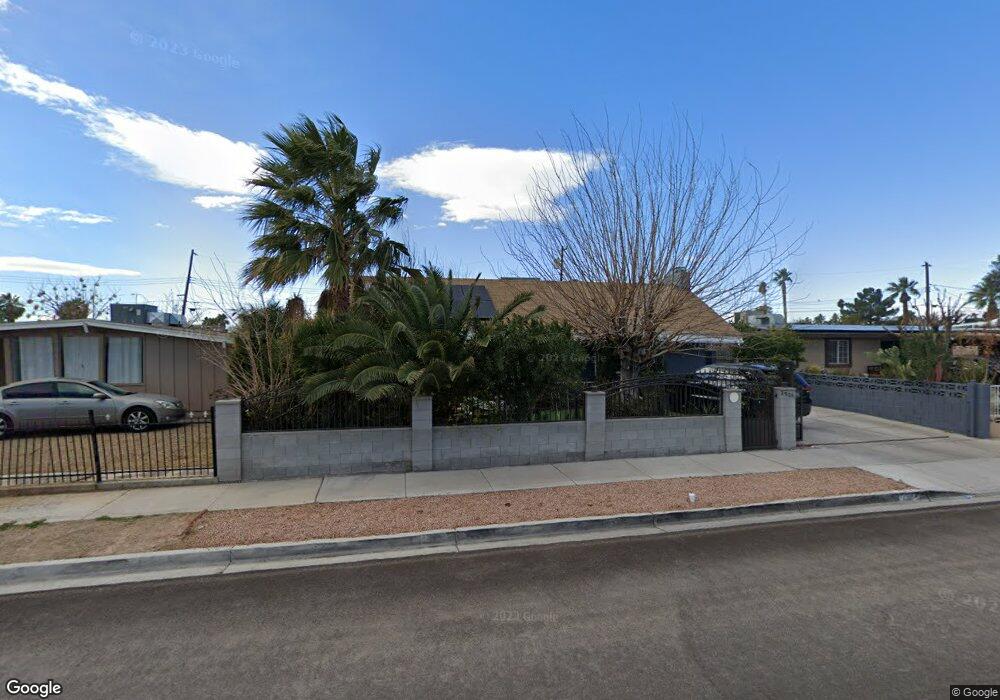
2904 Howard Dr Las Vegas, NV 89104
Huntridge NeighborhoodEstimated Value: $292,000 - $385,000
4
Beds
1
Bath
1,663
Sq Ft
$207/Sq Ft
Est. Value
About This Home
This home is located at 2904 Howard Dr, Las Vegas, NV 89104 and is currently estimated at $344,512, approximately $207 per square foot. 2904 Howard Dr is a home located in Clark County with nearby schools including Crestwood Elementary School, Knudson Academy of the Arts, and Valley High School.
Ownership History
Date
Name
Owned For
Owner Type
Purchase Details
Closed on
Oct 23, 2006
Sold by
Madero Aceano B and Madero Paula
Bought by
Madero Aceano B and Madero Paula
Current Estimated Value
Home Financials for this Owner
Home Financials are based on the most recent Mortgage that was taken out on this home.
Original Mortgage
$241,750
Outstanding Balance
$153,881
Interest Rate
7.7%
Mortgage Type
Unknown
Estimated Equity
$190,631
Purchase Details
Closed on
Apr 25, 2000
Sold by
Lopez Angel M and Hernandez Isidra
Bought by
Madero Aceano B and Madero Paula
Purchase Details
Closed on
Nov 25, 1998
Sold by
Madero Aceano B and Madero Paula
Bought by
Lopez Angel M and Hernandez Isidra
Purchase Details
Closed on
Sep 20, 1993
Sold by
Meager Edward R and Meager Leatha V
Bought by
Madero Aceano B and Madero Paula
Home Financials for this Owner
Home Financials are based on the most recent Mortgage that was taken out on this home.
Original Mortgage
$83,687
Interest Rate
7.25%
Mortgage Type
FHA
Create a Home Valuation Report for This Property
The Home Valuation Report is an in-depth analysis detailing your home's value as well as a comparison with similar homes in the area
Home Values in the Area
Average Home Value in this Area
Purchase History
| Date | Buyer | Sale Price | Title Company |
|---|---|---|---|
| Madero Aceano B | -- | Title One | |
| Madero Aceano B | $79,000 | -- | |
| Lopez Angel M | $84,000 | -- | |
| Madero Aceano B | $83,900 | Old Republic Title |
Source: Public Records
Mortgage History
| Date | Status | Borrower | Loan Amount |
|---|---|---|---|
| Open | Madero Aceano B | $241,750 | |
| Previous Owner | Madero Aceano B | $83,687 |
Source: Public Records
Tax History Compared to Growth
Tax History
| Year | Tax Paid | Tax Assessment Tax Assessment Total Assessment is a certain percentage of the fair market value that is determined by local assessors to be the total taxable value of land and additions on the property. | Land | Improvement |
|---|---|---|---|---|
| 2025 | $886 | $43,347 | $24,850 | $18,497 |
| 2024 | $821 | $43,347 | $24,850 | $18,497 |
| 2023 | $821 | $46,115 | $29,400 | $16,715 |
| 2022 | $761 | $28,906 | $14,000 | $14,906 |
| 2021 | $705 | $26,126 | $12,250 | $13,876 |
| 2020 | $651 | $25,720 | $12,250 | $13,470 |
| 2019 | $610 | $25,290 | $12,250 | $13,040 |
| 2018 | $582 | $26,846 | $14,700 | $12,146 |
| 2017 | $830 | $25,332 | $13,300 | $12,032 |
| 2016 | $547 | $18,367 | $6,650 | $11,717 |
| 2015 | $544 | $16,591 | $4,550 | $12,041 |
| 2014 | $527 | $15,607 | $3,500 | $12,107 |
Source: Public Records
Map
Nearby Homes
- 2705 Howard Dr
- 2124 Paradise
- 1708 Weeping Willow Ln
- 1716 Pacific St
- 3260 N Heritage Way
- 2635 Heritage Ct
- 1404 Atlantic St
- 2640 Heritage Ct
- 2038 Palm St Unit 60
- 2038 Palm St Unit 427
- 2038 Palm St Unit 321
- 2038 Palm St Unit 298
- 2038 Palm St Unit 47
- 2038 Palm St Unit 81
- 2038 Palm St Unit 169
- 2038 Palm St Unit 98
- 2038 Palm St Unit 275
- 2038 Palm St Unit 189
- 2038 Palm St Unit 307
- 2038 Palm St Unit 452
- 2908 Howard Dr
- 2900 Howard Dr
- 2912 Howard Dr
- 1913 Silver Birch Ln
- 2820 Howard Dr
- 1917 Silver Birch Ln
- 1909 Silver Birch Ln
- 3005 E Saint Louis Ave
- 3009 E Saint Louis Ave
- 2905 Howard Dr
- 2909 Howard Dr
- 2901 Howard Dr
- 2816 Howard Dr
- 2916 Howard Dr
- 1921 Silver Birch Ln
- 1905 Silver Birch Ln
- 2821 Howard Dr
- 2913 Howard Dr
- 2812 Howard Dr
- 0 E Saint Louis Ave