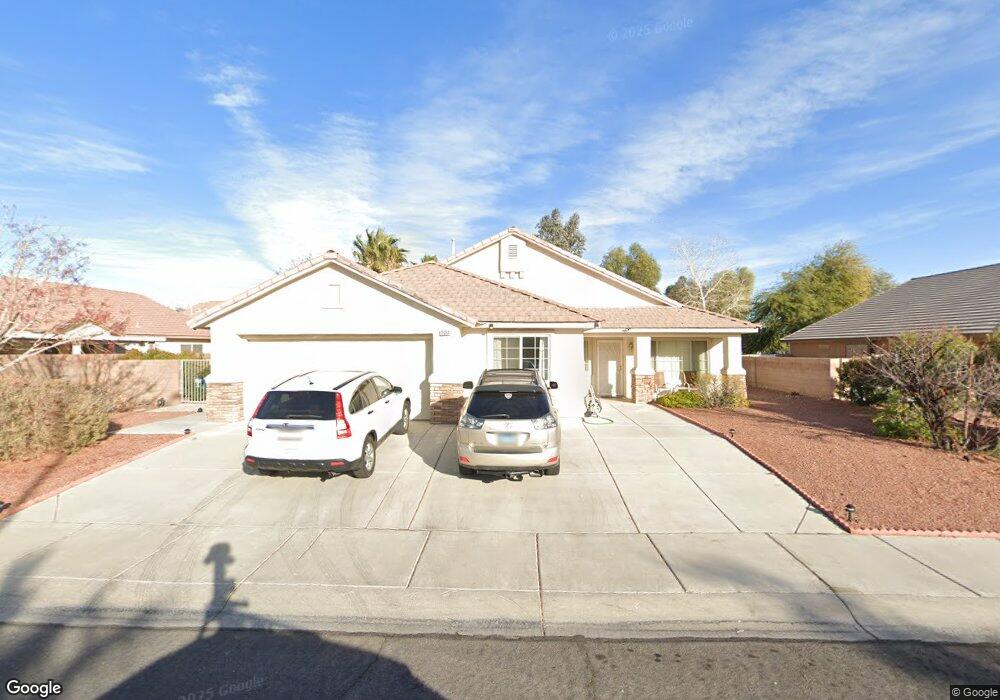
2904 Jeffery Pines St Las Vegas, NV 89108
Michael Way NeighborhoodEstimated Value: $460,000 - $527,000
4
Beds
3
Baths
2,213
Sq Ft
$219/Sq Ft
Est. Value
About This Home
This home is located at 2904 Jeffery Pines St, Las Vegas, NV 89108 and is currently estimated at $485,416, approximately $219 per square foot. 2904 Jeffery Pines St is a home located in Clark County with nearby schools including Doris M. Reed Elementary School, Irwin & Susan Molasky Junior High School, and Cimarron Memorial High School.
Ownership History
Date
Name
Owned For
Owner Type
Purchase Details
Closed on
Sep 15, 2004
Sold by
Garrison John T and Garrison Delores M
Bought by
Hunt Derryk D and Hunt Estella L
Current Estimated Value
Home Financials for this Owner
Home Financials are based on the most recent Mortgage that was taken out on this home.
Original Mortgage
$260,000
Outstanding Balance
$124,405
Interest Rate
5.37%
Mortgage Type
Unknown
Estimated Equity
$361,011
Purchase Details
Closed on
Dec 14, 2000
Sold by
Garrison John T and Garrison Delores Marie
Bought by
Garrison John T and Garrison Delores M
Purchase Details
Closed on
Dec 28, 1999
Sold by
Capital Pacific Holdings Llc
Bought by
Garrison John T and Garrison Delores Marie
Home Financials for this Owner
Home Financials are based on the most recent Mortgage that was taken out on this home.
Original Mortgage
$103,240
Interest Rate
7.69%
Create a Home Valuation Report for This Property
The Home Valuation Report is an in-depth analysis detailing your home's value as well as a comparison with similar homes in the area
Home Values in the Area
Average Home Value in this Area
Purchase History
| Date | Buyer | Sale Price | Title Company |
|---|---|---|---|
| Hunt Derryk D | $325,000 | Ticor Title Of Nevada Inc | |
| Garrison John T | -- | -- | |
| Garrison John T | $159,410 | Nevada Title Company |
Source: Public Records
Mortgage History
| Date | Status | Borrower | Loan Amount |
|---|---|---|---|
| Open | Hunt Derryk D | $260,000 | |
| Previous Owner | Garrison John T | $103,240 |
Source: Public Records
Tax History Compared to Growth
Tax History
| Year | Tax Paid | Tax Assessment Tax Assessment Total Assessment is a certain percentage of the fair market value that is determined by local assessors to be the total taxable value of land and additions on the property. | Land | Improvement |
|---|---|---|---|---|
| 2025 | $1,832 | $112,681 | $30,100 | $82,581 |
| 2024 | $1,780 | $112,681 | $30,100 | $82,581 |
| 2023 | $1,780 | $109,951 | $31,850 | $78,101 |
| 2022 | $1,728 | $96,731 | $25,200 | $71,531 |
| 2021 | $1,678 | $92,865 | $24,850 | $68,015 |
| 2020 | $1,626 | $91,189 | $23,800 | $67,389 |
| 2019 | $1,578 | $86,678 | $20,300 | $66,378 |
| 2018 | $1,532 | $79,302 | $15,400 | $63,902 |
| 2017 | $2,402 | $73,262 | $14,350 | $58,912 |
| 2016 | $1,452 | $58,711 | $10,150 | $48,561 |
| 2015 | $1,448 | $49,183 | $7,000 | $42,183 |
| 2014 | $1,403 | $41,533 | $6,300 | $35,233 |
Source: Public Records
Map
Nearby Homes
- 2913 N Michael Way
- 2829 N Michael Way
- 5500 Avenida Vaquero
- 5325 Redberry St
- 5705 Mossman Ave
- 5305 W Cheyenne Ave
- 5113 Mambo Vista Ave
- 5486 Alfred Dr
- 0 W Cheyenne Ave
- 5041 Sublight Ave
- 3217 Joann Way
- 2753 Stargate St
- 5710 Madre Mesa Dr
- 2601 La Mata St
- 2760 Stargate St
- 5401 Bugle Way Unit 103
- 5066 El Castano Ave
- 5537 Cleary Ct
- 5807 Madre Mesa Dr
- 5401 Geneive Ln Unit 101
- 2900 Jeffery Pines St
- 5317 Clouds Rest Ave
- 5313 Clouds Rest Ave
- 5308 Your Ave
- 2821 Porcupine Flat St
- 2820 Jeffery Pines St
- 2905 Jeffery Pines St
- 2901 Jeffery Pines St
- 5309 Clouds Rest Ave
- 2909 Jeffery Pines St
- 2821 Jeffery Pines St
- 5304 Your Ave
- 2817 Porcupine Flat St
- 2816 Jeffery Pines St
- 5312 Clouds Rest Ave
- 5316 Clouds Rest Ave
- 2817 Jeffery Pines St
- 5308 Clouds Rest Ave
- 2813 Porcupine Flat St
- 5300 Your Ave