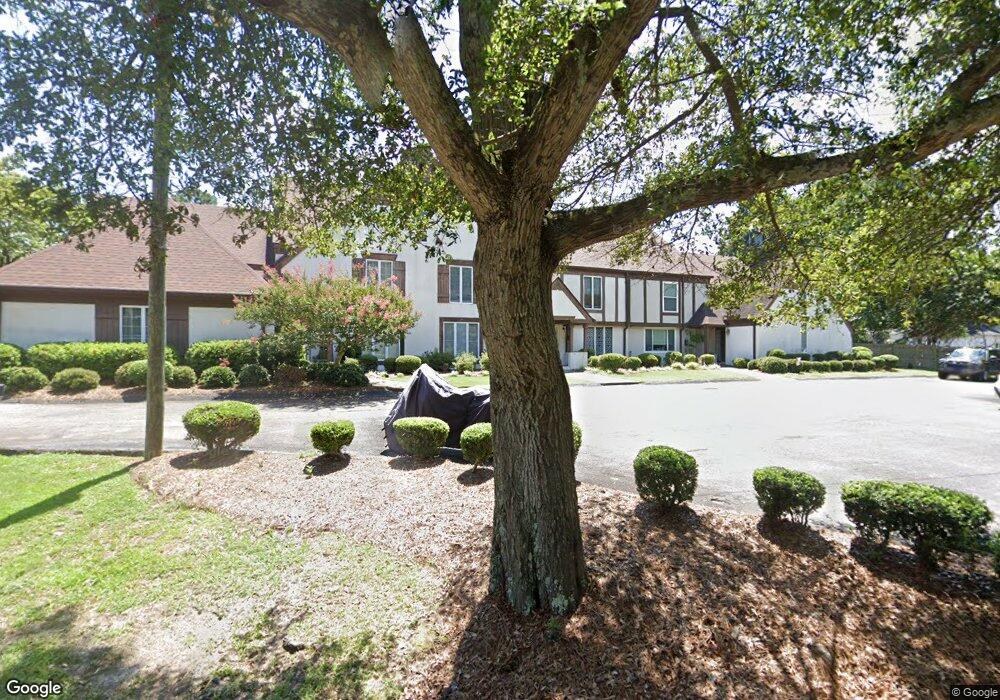
2904 Lake Forest Dr Augusta, GA 30909
Forest Hills NeighborhoodEstimated Value: $211,907 - $248,000
3
Beds
3
Baths
1,650
Sq Ft
$141/Sq Ft
Est. Value
About This Home
This home is located at 2904 Lake Forest Dr, Augusta, GA 30909 and is currently estimated at $232,977, approximately $141 per square foot. 2904 Lake Forest Dr is a home located in Richmond County with nearby schools including R.B. Hunt Elementary School, Lake Forest Hills Elementary School, and Langford Middle School.
Ownership History
Date
Name
Owned For
Owner Type
Purchase Details
Closed on
Nov 16, 2018
Sold by
Wyatt Russell O
Bought by
Price Katherine
Current Estimated Value
Purchase Details
Closed on
Apr 30, 2013
Sold by
Vann Marcelene N
Bought by
Wyatt Neely Vann and Wyatt Russell O
Purchase Details
Closed on
Jun 9, 1997
Sold by
Johannsen Leonora M
Bought by
Johannsen A Patrick
Purchase Details
Closed on
Sep 16, 1991
Sold by
Gary William T
Bought by
Johannsen Leonora M
Purchase Details
Closed on
Aug 1, 1987
Sold by
Trio Developers Inc
Bought by
Gary William T
Create a Home Valuation Report for This Property
The Home Valuation Report is an in-depth analysis detailing your home's value as well as a comparison with similar homes in the area
Home Values in the Area
Average Home Value in this Area
Purchase History
| Date | Buyer | Sale Price | Title Company |
|---|---|---|---|
| Price Katherine | $150,000 | -- | |
| Wyatt Neely Vann | -- | -- | |
| Johannsen A Patrick | -- | -- | |
| Johannsen Leonora M | $72,000 | -- | |
| Gary William T | $75,000 | -- |
Source: Public Records
Tax History Compared to Growth
Tax History
| Year | Tax Paid | Tax Assessment Tax Assessment Total Assessment is a certain percentage of the fair market value that is determined by local assessors to be the total taxable value of land and additions on the property. | Land | Improvement |
|---|---|---|---|---|
| 2025 | $1,094 | $74,676 | $10,000 | $64,676 |
| 2024 | $1,094 | $66,068 | $10,000 | $56,068 |
| 2023 | $2,227 | $65,488 | $10,000 | $55,488 |
| 2022 | $1,451 | $37,291 | $10,000 | $27,291 |
| 2021 | $1,711 | $41,709 | $10,000 | $31,709 |
| 2020 | $1,589 | $38,709 | $7,000 | $31,709 |
| 2019 | $1,681 | $38,709 | $7,000 | $31,709 |
| 2018 | $1,694 | $38,709 | $7,000 | $31,709 |
| 2017 | $1,686 | $38,709 | $7,000 | $31,709 |
| 2016 | $1,686 | $38,709 | $7,000 | $31,709 |
| 2015 | $1,696 | $38,709 | $7,000 | $31,709 |
| 2014 | $1,580 | $35,426 | $7,000 | $28,426 |
Source: Public Records
Map
Nearby Homes
- 2875 Lake Forest Dr
- 3348 Walton Way
- 2923 Henry St
- 3012 Walton Way
- 3011 Fox Spring Rd
- 814 Windsor Ct
- 2904 Lombardy Ct
- 2818 Hazel St
- 1117 Highland Ave
- 2716 Hazel St
- 2812 Helen St
- 904 Highland Ave
- 2713 Hazel St
- 600 Bransford Rd
- 712 Westminster Ct
- 542 Basin St
- 543 Basin St
- 3013 Cardinal Dr
- 533 Basin St
- 1425 Glenn Ave
- 2904 Lake Forest Dr Unit 4
- 2904 Lake Forest Dr
- 2904 Lake Forest Dr
- 2904 Lake Forest Dr
- 2904 Lake Forest Dr
- 2904 Lake Unit 6
- 2846 Walton Way Unit 3
- 2846 Walton Way Unit 36
- 2846 Walton Way
- 2846 Walton Way Unit 25
- 2846 Walton Way Unit 1
- 2846 Walton Way Unit 24
- 2846 Walton Way Unit 41
- 2846 Walton Way
- 2846 Walton Way Unit 39
- 2846 Walton Way
- 2846 Walton Way
- 2846 Walton Way
- 2846 Walton Way
- 2846 Walton Way Unit 34