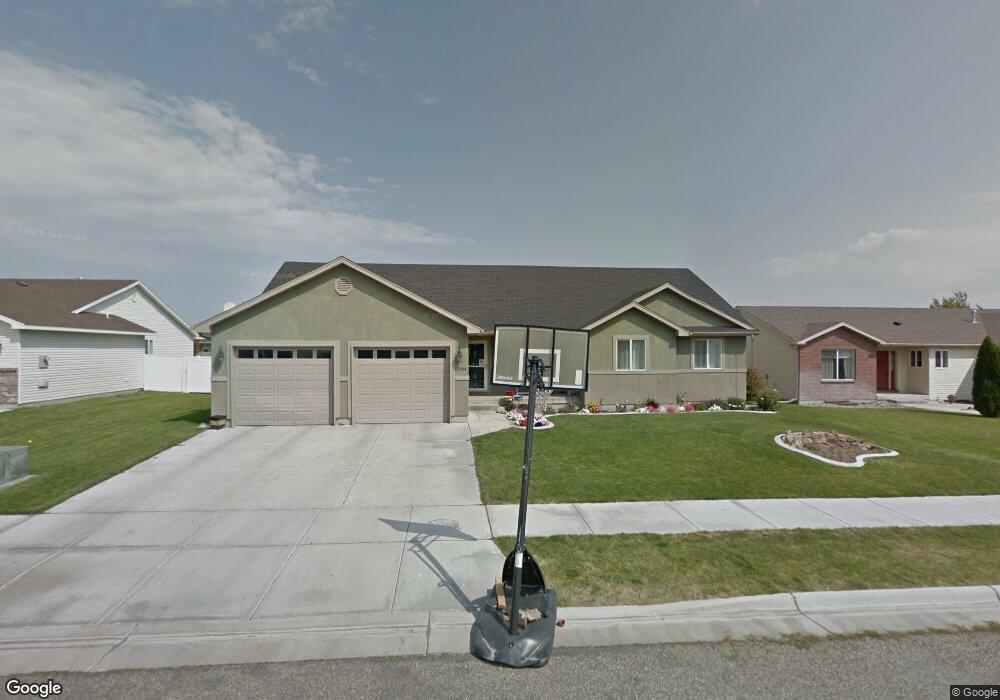
2904 Lianne St Idaho Falls, ID 83402
Estimated Value: $475,000 - $484,000
3
Beds
2
Baths
3,322
Sq Ft
$144/Sq Ft
Est. Value
About This Home
This home is located at 2904 Lianne St, Idaho Falls, ID 83402 and is currently estimated at $479,327, approximately $144 per square foot. 2904 Lianne St is a home located in Bonneville County with nearby schools including Westside Elementary School, Eagle Rock Middle School, and Skyline Senior High School.
Ownership History
Date
Name
Owned For
Owner Type
Purchase Details
Closed on
Dec 15, 2008
Sold by
Jensen Leann M and Jensen Leanne M
Bought by
Clark Jefrey D and Clark Sarah N
Current Estimated Value
Home Financials for this Owner
Home Financials are based on the most recent Mortgage that was taken out on this home.
Original Mortgage
$198,412
Outstanding Balance
$131,292
Interest Rate
6.16%
Mortgage Type
FHA
Estimated Equity
$348,035
Purchase Details
Closed on
Feb 20, 2007
Sold by
Jensen Leann
Bought by
Jensen Leann M
Home Financials for this Owner
Home Financials are based on the most recent Mortgage that was taken out on this home.
Original Mortgage
$156,000
Interest Rate
6.23%
Mortgage Type
New Conventional
Purchase Details
Closed on
Feb 6, 2006
Sold by
Leland Jensen Const Inc
Bought by
Jensen Justin and Jensen Leann
Home Financials for this Owner
Home Financials are based on the most recent Mortgage that was taken out on this home.
Original Mortgage
$151,200
Interest Rate
6.21%
Mortgage Type
Construction
Create a Home Valuation Report for This Property
The Home Valuation Report is an in-depth analysis detailing your home's value as well as a comparison with similar homes in the area
Home Values in the Area
Average Home Value in this Area
Purchase History
| Date | Buyer | Sale Price | Title Company |
|---|---|---|---|
| Clark Jefrey D | -- | Alliance Title | |
| Jensen Leann M | -- | Amerititle | |
| Jensen Leann A | -- | Amerititle | |
| Jensen Justin | -- | Amerititle |
Source: Public Records
Mortgage History
| Date | Status | Borrower | Loan Amount |
|---|---|---|---|
| Open | Clark Jefrey D | $198,412 | |
| Previous Owner | Jensen Leann A | $156,000 | |
| Previous Owner | Jensen Justin | $151,200 |
Source: Public Records
Tax History Compared to Growth
Tax History
| Year | Tax Paid | Tax Assessment Tax Assessment Total Assessment is a certain percentage of the fair market value that is determined by local assessors to be the total taxable value of land and additions on the property. | Land | Improvement |
|---|---|---|---|---|
| 2025 | $2,910 | $573,042 | $80,076 | $492,966 |
| 2024 | $2,910 | $526,548 | $55,914 | $470,634 |
| 2023 | $2,615 | $469,574 | $55,914 | $413,660 |
| 2022 | $3,748 | $422,521 | $48,611 | $373,910 |
| 2021 | $3,235 | $309,820 | $44,170 | $265,650 |
| 2019 | $3,265 | $288,058 | $38,408 | $249,650 |
| 2018 | $2,680 | $283,520 | $34,920 | $248,600 |
| 2017 | $2,427 | $242,666 | $31,746 | $210,920 |
| 2016 | $2,278 | $230,414 | $30,204 | $200,210 |
| 2015 | $2,241 | $209,538 | $30,204 | $179,334 |
| 2014 | $49,112 | $209,538 | $26,938 | $182,600 |
| 2013 | $3,071 | $251,508 | $26,938 | $224,570 |
Source: Public Records
Map
Nearby Homes
- 2836 Dorothy St
- 3010 Simon St
- 950 Clarence Dr
- 940 Clarence Dr
- 3179 Stella Dr
- 1493 Helix Blvd
- 1548 Ernest Dr
- 2819 W Meadow Lark Ln
- 701 Moonlite Dr
- 604 Neptune Dr
- 490 Moonlite Dr
- 2000 N 26th W
- 2483 Mars St
- 2840 Vesta St
- 648 Buckboard Ln
- 867 Coachman Dr
- 863 Coachman Dr
- 429 Buckboard Ln
- 290 Donna Dr
- 2288 Trivet St