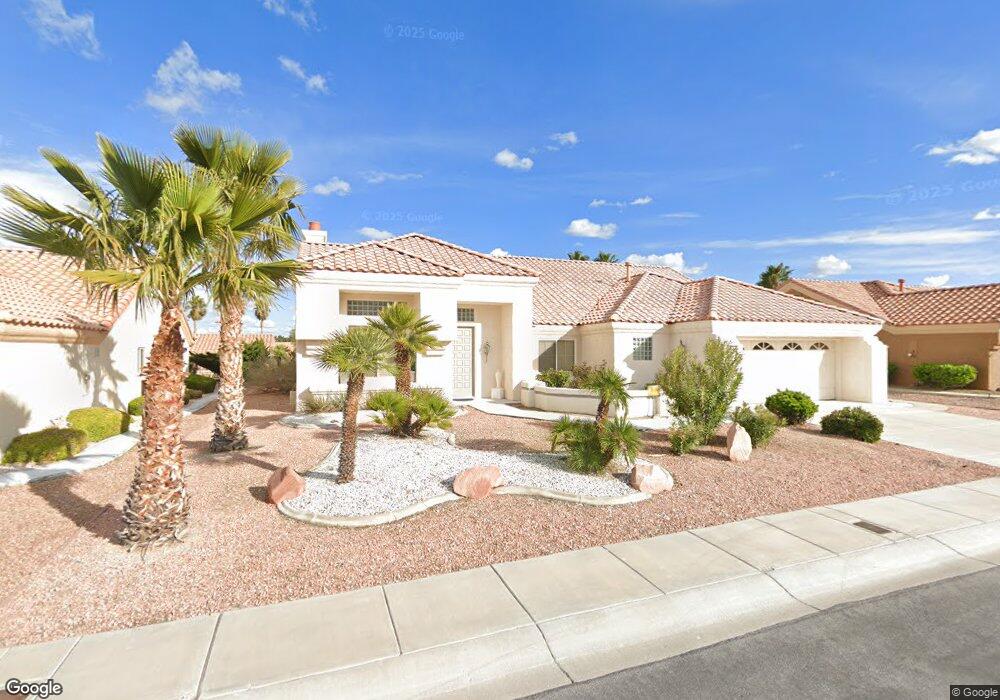
2904 Lotus Hill Dr Unit 27 Las Vegas, NV 89134
Sun City Summerlin NeighborhoodEstimated Value: $525,000 - $768,000
3
Beds
2
Baths
2,486
Sq Ft
$263/Sq Ft
Est. Value
About This Home
This home is located at 2904 Lotus Hill Dr Unit 27, Las Vegas, NV 89134 and is currently estimated at $653,311, approximately $262 per square foot. 2904 Lotus Hill Dr Unit 27 is a home located in Clark County with nearby schools including William Lummis Elementary School, Ernest Becker Middle School, and Palo Verde High School.
Ownership History
Date
Name
Owned For
Owner Type
Purchase Details
Closed on
Dec 10, 2004
Sold by
Luberacki Robert J and Luberacki Hideko
Bought by
Lanquist Gary C and Lanquist Margine E
Current Estimated Value
Home Financials for this Owner
Home Financials are based on the most recent Mortgage that was taken out on this home.
Original Mortgage
$300,000
Outstanding Balance
$146,626
Interest Rate
5.37%
Mortgage Type
Unknown
Estimated Equity
$506,685
Purchase Details
Closed on
Oct 21, 2002
Sold by
Luberacki Robert J and Luberacki Hideko
Bought by
Luberacki Robert J and Luberacki Hideko
Purchase Details
Closed on
Jul 11, 2002
Sold by
Benoit Henry L and Benoit Janice B
Bought by
Luberacki Robert J and Luberacki Hideko O
Home Financials for this Owner
Home Financials are based on the most recent Mortgage that was taken out on this home.
Original Mortgage
$160,000
Interest Rate
6.69%
Create a Home Valuation Report for This Property
The Home Valuation Report is an in-depth analysis detailing your home's value as well as a comparison with similar homes in the area
Home Values in the Area
Average Home Value in this Area
Purchase History
| Date | Buyer | Sale Price | Title Company |
|---|---|---|---|
| Lanquist Gary C | $375,000 | Land Title Of Nevada | |
| Luberacki Robert J | -- | -- | |
| Luberacki Robert J | $294,000 | First American Title Co |
Source: Public Records
Mortgage History
| Date | Status | Borrower | Loan Amount |
|---|---|---|---|
| Open | Lanquist Gary C | $300,000 | |
| Previous Owner | Luberacki Robert J | $160,000 |
Source: Public Records
Tax History Compared to Growth
Tax History
| Year | Tax Paid | Tax Assessment Tax Assessment Total Assessment is a certain percentage of the fair market value that is determined by local assessors to be the total taxable value of land and additions on the property. | Land | Improvement |
|---|---|---|---|---|
| 2025 | $4,271 | $135,878 | $43,400 | $92,478 |
| 2024 | $3,955 | $135,878 | $43,400 | $92,478 |
| 2023 | $2,668 | $123,472 | $35,000 | $88,472 |
| 2022 | $3,663 | $111,629 | $30,450 | $81,179 |
| 2021 | $3,436 | $106,518 | $28,700 | $77,818 |
| 2020 | $3,188 | $106,223 | $28,700 | $77,523 |
| 2019 | $2,987 | $100,923 | $24,150 | $76,773 |
| 2018 | $2,851 | $94,531 | $20,300 | $74,231 |
| 2017 | $3,070 | $92,801 | $18,200 | $74,601 |
| 2016 | $2,668 | $90,905 | $16,100 | $74,805 |
| 2015 | $2,663 | $87,373 | $13,300 | $74,073 |
| 2014 | $2,585 | $83,781 | $11,550 | $72,231 |
Source: Public Records
Map
Nearby Homes
- 2916 Hawksdale Dr
- 2925 Lotus Hill Dr
- 2837 Billy Casper Dr
- 2821 Tumble Brook Dr
- 3004 Lotus Hill Dr
- 3012 Hawksdale Dr
- 3016 Lotus Hill Dr
- 3016 High Range Dr
- 9525 Salem Hills Ct
- 2937 Billy Casper Dr
- 9800 Rosamond Dr
- 9536 Ruby Hills Dr
- 2725 Youngdale Dr
- 9816 Gerald Ct
- 9908 Bundella Dr
- 2712 Lotus Hill Dr
- 3109 Hawksdale Dr Unit 27
- 3112 Haddon Dr
- 9905 Hemet Dr
- 9536 Eagle Valley Dr Unit 22
- 2908 Lotus Hill Dr
- 2900 Lotus Hill Dr
- 2905 Hawksdale Dr
- 2909 Hawksdale Dr
- 2901 Hawksdale Dr
- 2912 Lotus Hill Dr
- 2905 Lotus Hill Dr
- 2909 Lotus Hill Dr
- 2901 Lotus Hill Dr
- 2913 Lotus Hill Dr
- 9613 Pikedale Dr
- 9609 Pikedale Dr Unit 27
- 2916 Lotus Hill Dr
- 2917 Hawksdale Dr
- 2904 Hawksdale Dr
- 9605 Pikedale Dr
- 2908 Hawksdale Dr
- 2908 Haddon Dr
- 2917 Lotus Hill Dr
- 2904 Haddon Dr