29040 Chestnut Ridge Rd Danville, OH 43014
Estimated Value: $232,084 - $415,000
3
Beds
1
Bath
1,336
Sq Ft
$251/Sq Ft
Est. Value
About This Home
This home is located at 29040 Chestnut Ridge Rd, Danville, OH 43014 and is currently estimated at $334,695, approximately $250 per square foot. 29040 Chestnut Ridge Rd is a home with nearby schools including East Knox Elementary School and East Knox High School.
Ownership History
Date
Name
Owned For
Owner Type
Purchase Details
Closed on
Jan 24, 2025
Sold by
Weaver Andy E
Bought by
Weaver Andy E and Weaver Orpha L
Current Estimated Value
Purchase Details
Closed on
Oct 6, 2023
Sold by
David Cooper Carroll and Mast Martha
Bought by
Weaver Andy E
Home Financials for this Owner
Home Financials are based on the most recent Mortgage that was taken out on this home.
Original Mortgage
$196,000
Interest Rate
7.18%
Mortgage Type
Credit Line Revolving
Purchase Details
Closed on
Jan 12, 2022
Sold by
Cooper Carroll and Cooper Martha Omast
Bought by
Cooper Carroll David
Purchase Details
Closed on
Jun 9, 2000
Sold by
Jacobs George Webster
Bought by
Cooper Carroll
Purchase Details
Closed on
Feb 1, 1995
Sold by
Slack Creta Sellers
Bought by
Jacobs George Webster
Create a Home Valuation Report for This Property
The Home Valuation Report is an in-depth analysis detailing your home's value as well as a comparison with similar homes in the area
Home Values in the Area
Average Home Value in this Area
Purchase History
| Date | Buyer | Sale Price | Title Company |
|---|---|---|---|
| Weaver Andy E | -- | None Listed On Document | |
| Weaver Andy E | -- | None Listed On Document | |
| Weaver Andy E | -- | None Listed On Document | |
| Cooper Carroll David | -- | None Listed On Document | |
| Cooper Carroll David | -- | None Listed On Document | |
| Cooper Carroll | -- | -- | |
| Jacobs George Webster | -- | -- |
Source: Public Records
Mortgage History
| Date | Status | Borrower | Loan Amount |
|---|---|---|---|
| Previous Owner | Weaver Andy E | $196,000 |
Source: Public Records
Tax History Compared to Growth
Tax History
| Year | Tax Paid | Tax Assessment Tax Assessment Total Assessment is a certain percentage of the fair market value that is determined by local assessors to be the total taxable value of land and additions on the property. | Land | Improvement |
|---|---|---|---|---|
| 2024 | $2,349 | $56,380 | $24,120 | $32,260 |
| 2023 | $2,349 | $56,380 | $24,120 | $32,260 |
| 2022 | $1,867 | $38,880 | $16,630 | $22,250 |
| 2021 | $1,867 | $38,880 | $16,630 | $22,250 |
| 2020 | $1,781 | $38,880 | $16,630 | $22,250 |
| 2019 | $1,618 | $32,630 | $11,110 | $21,520 |
| 2018 | $1,518 | $32,630 | $11,110 | $21,520 |
| 2017 | $1,505 | $32,630 | $11,110 | $21,520 |
| 2016 | $1,412 | $30,220 | $10,290 | $19,930 |
| 2015 | $1,288 | $30,220 | $10,290 | $19,930 |
| 2014 | $1,230 | $30,220 | $10,290 | $19,930 |
| 2013 | $1,279 | $29,810 | $9,150 | $20,660 |
Source: Public Records
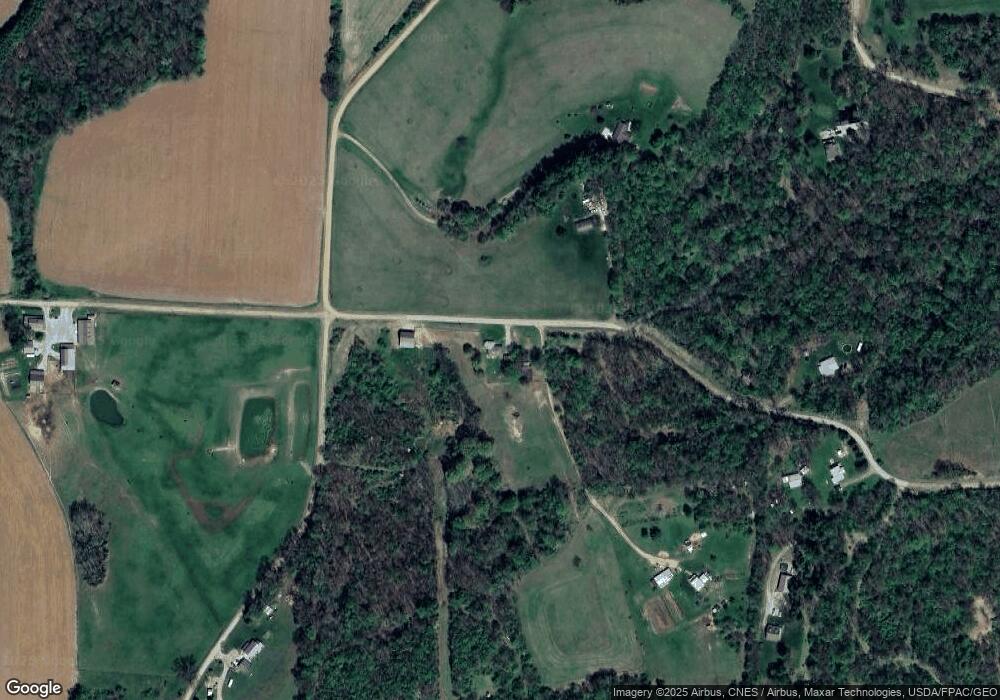
Map
Nearby Homes
- 29095 Chestnut Ridge Rd
- 12160 Shoemaker Rd
- 29240 Chestnut Ridge Rd
- 29221 Chestnut Ridge Rd
- 0 Chestnut Ridge Rd Unit 4038675
- 0 Chestnut Ridge Rd Unit 3930851
- 0 Chestnut Ridge Rd Unit 4492512
- 0 Chestnut Ridge Rd Unit 4492433
- 0 Chestnut Ridge Rd Unit 9018081
- 0 Chestnut Ridge Rd Unit 9030664
- 0 Chestnut Ridge Rd Unit 210043737
- 0 Chestnut Ridge Rd Unit 4247055
- 0 Chestnut Ridge Rd Unit 20130093
- 0 Chestnut Ridge Rd Unit 20150789
- 0 Chestnut Ridge Rd Unit 211024646
- 0 Chestnut Ridge Rd Unit 211034550
- 0 Chestnut Ridge Rd Unit 213003617
- 0 Chestnut Ridge Rd Unit 215026718
- 23900 Chestnut Ridge Rd
- 29400 Chestnut Ridge Rd