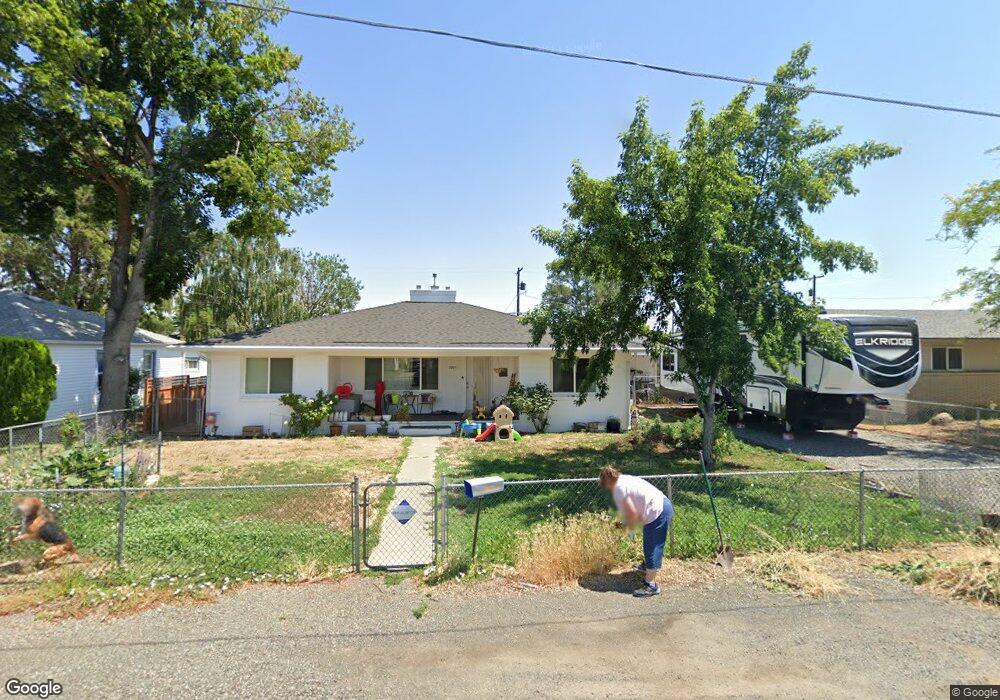
2905 3rd St Union Gap, WA 98903
Estimated Value: $286,267 - $358,000
3
Beds
1
Bath
1,368
Sq Ft
$228/Sq Ft
Est. Value
About This Home
This home is located at 2905 3rd St, Union Gap, WA 98903 and is currently estimated at $311,817, approximately $227 per square foot. 2905 3rd St is a home located in Yakima County with nearby schools including Union Gap School and La Salle High School.
Ownership History
Date
Name
Owned For
Owner Type
Purchase Details
Closed on
May 8, 2007
Sold by
Umberger Patrick E and Umberger Carrie J
Bought by
Vannattan Bradley S and Vannattan Kristal L
Current Estimated Value
Home Financials for this Owner
Home Financials are based on the most recent Mortgage that was taken out on this home.
Original Mortgage
$136,000
Outstanding Balance
$82,725
Interest Rate
6.17%
Mortgage Type
New Conventional
Estimated Equity
$229,092
Purchase Details
Closed on
Apr 20, 2005
Sold by
Edgerly Michael R
Bought by
Umberger Patrick E and Umberger Carrie J
Home Financials for this Owner
Home Financials are based on the most recent Mortgage that was taken out on this home.
Original Mortgage
$124,112
Interest Rate
5.84%
Mortgage Type
VA
Purchase Details
Closed on
May 25, 1999
Sold by
Beard Marvin A and Beard Karen M
Bought by
Edgerly Michael R
Home Financials for this Owner
Home Financials are based on the most recent Mortgage that was taken out on this home.
Original Mortgage
$91,800
Interest Rate
6.86%
Mortgage Type
VA
Create a Home Valuation Report for This Property
The Home Valuation Report is an in-depth analysis detailing your home's value as well as a comparison with similar homes in the area
Home Values in the Area
Average Home Value in this Area
Purchase History
| Date | Buyer | Sale Price | Title Company |
|---|---|---|---|
| Vannattan Bradley S | $136,000 | First American Title Comp | |
| Umberger Patrick E | $121,173 | Valley Title Company | |
| Edgerly Michael R | $90,000 | First American Title Ins Co |
Source: Public Records
Mortgage History
| Date | Status | Borrower | Loan Amount |
|---|---|---|---|
| Open | Vannattan Bradley S | $136,000 | |
| Previous Owner | Umberger Patrick E | $124,112 | |
| Previous Owner | Edgerly Michael R | $91,800 |
Source: Public Records
Tax History
| Year | Tax Paid | Tax Assessment Tax Assessment Total Assessment is a certain percentage of the fair market value that is determined by local assessors to be the total taxable value of land and additions on the property. | Land | Improvement |
|---|---|---|---|---|
| 2025 | $2,111 | $260,500 | $41,600 | $218,900 |
| 2023 | $1,676 | $199,900 | $26,200 | $173,700 |
| 2022 | $1,866 | $183,800 | $26,200 | $157,600 |
| 2021 | $1,720 | $160,700 | $26,200 | $134,500 |
| 2019 | $1,345 | $134,600 | $26,200 | $108,400 |
| 2018 | $1,318 | $117,800 | $26,200 | $91,600 |
| 2017 | $1,182 | $111,900 | $26,200 | $85,700 |
| 2016 | $1,425 | $111,350 | $26,250 | $85,100 |
| 2015 | $1,425 | $112,650 | $26,250 | $86,400 |
| 2014 | $1,425 | $112,850 | $26,250 | $86,600 |
| 2013 | $1,425 | $112,850 | $26,250 | $86,600 |
Source: Public Records
Map
Nearby Homes
- 2907 S 3rd St
- 2810 S 2nd St
- 403 W Ahtanum Rd
- 500 Richards Rd
- 102 E California St Unit 6
- NKA Ahtanum Ridge Dr Unit 5
- 1236 Ahtanum Ridge Dr Unit 12
- 1236 Ahtanum Ridge Dr Unit 11
- 2007 Longfibre Rd
- 4207 Main St
- 18 W Washington Ave Unit 23
- 18 W Washington Ave Unit 142
- 18 W Washington Ave Unit 24
- 18 W Washington Ave Unit 27
- 1904 Mcnair Ave
- 0 Goodman Rd
- 2709 Riverside Rd
- 53 & 55 Samantha Ct
- 1710 Rudkin Rd
- 1917 Landon Ave Unit 1 & 2
Your Personal Tour Guide
Ask me questions while you tour the home.