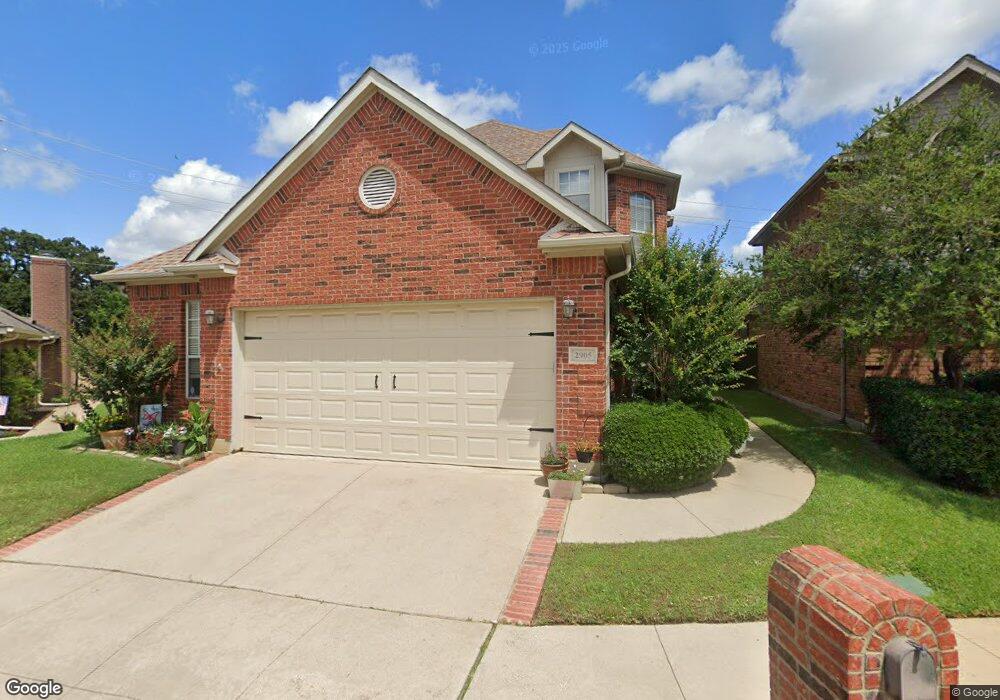
2905 Everest Dr Bedford, TX 76021
Estimated Value: $398,000 - $442,000
3
Beds
2
Baths
2,143
Sq Ft
$196/Sq Ft
Est. Value
About This Home
This home is located at 2905 Everest Dr, Bedford, TX 76021 and is currently estimated at $419,010, approximately $195 per square foot. 2905 Everest Dr is a home located in Tarrant County with nearby schools including Bedford Heights Elementary School, Bedford Junior High School, and L.D. Bell High School.
Ownership History
Date
Name
Owned For
Owner Type
Purchase Details
Closed on
Oct 30, 2006
Sold by
Blakeman Jeffrey A and Blakeman Cristina C
Bought by
Guess Karen F and Meagher Helene M
Current Estimated Value
Home Financials for this Owner
Home Financials are based on the most recent Mortgage that was taken out on this home.
Original Mortgage
$145,800
Outstanding Balance
$86,581
Interest Rate
6.28%
Mortgage Type
Purchase Money Mortgage
Estimated Equity
$332,429
Purchase Details
Closed on
May 30, 1997
Sold by
Pacific Southwest Bank Fsb
Bought by
Blakeman Jeffrey A
Home Financials for this Owner
Home Financials are based on the most recent Mortgage that was taken out on this home.
Original Mortgage
$105,600
Interest Rate
7.98%
Create a Home Valuation Report for This Property
The Home Valuation Report is an in-depth analysis detailing your home's value as well as a comparison with similar homes in the area
Home Values in the Area
Average Home Value in this Area
Purchase History
| Date | Buyer | Sale Price | Title Company |
|---|---|---|---|
| Guess Karen F | -- | Atc | |
| Blakeman Jeffrey A | -- | Alamo Title Co |
Source: Public Records
Mortgage History
| Date | Status | Borrower | Loan Amount |
|---|---|---|---|
| Open | Guess Karen F | $145,800 | |
| Previous Owner | Blakeman Jeffrey A | $105,600 |
Source: Public Records
Tax History Compared to Growth
Tax History
| Year | Tax Paid | Tax Assessment Tax Assessment Total Assessment is a certain percentage of the fair market value that is determined by local assessors to be the total taxable value of land and additions on the property. | Land | Improvement |
|---|---|---|---|---|
| 2025 | $6,108 | $446,683 | $70,000 | $376,683 |
| 2024 | $6,108 | $446,683 | $70,000 | $376,683 |
| 2023 | $6,639 | $412,970 | $45,000 | $367,970 |
| 2022 | $6,873 | $326,309 | $45,000 | $281,309 |
| 2021 | $6,739 | $318,364 | $45,000 | $273,364 |
| 2020 | $6,183 | $260,058 | $45,000 | $215,058 |
| 2019 | $6,527 | $275,025 | $45,000 | $230,025 |
| 2018 | $5,551 | $244,237 | $45,000 | $199,237 |
| 2017 | $5,594 | $231,226 | $30,000 | $201,226 |
| 2016 | $5,347 | $225,807 | $30,000 | $195,807 |
| 2015 | $4,552 | $200,933 | $30,000 | $170,933 |
| 2014 | $4,552 | $192,200 | $20,000 | $172,200 |
Source: Public Records
Map
Nearby Homes
- 1013 Springdale Rd
- 2704 Shady Grove Dr
- 922 Shady Creek Ln
- 2700 Shady Grove Dr
- 801 Shady Creek Ln
- 913 Kensington Ct
- 3119 Spring Grove Dr
- 1401 Danielle Dr
- 2508 Lakeview Dr
- 2501 Shady Grove Dr
- 3213 Spring Valley Dr
- 3301 Wendover Ct
- 2317 Shady Grove Dr
- 2901 Miles Way
- 1209 Hillandale Ct
- 817 Shady Lake Dr
- 3609 Wayne Ct
- 37 Devonshire Dr
- 1636 Bedford Oaks Dr
- 1704 Indian Oaks Ct
- 2909 Everest Dr
- 2901 Everest Dr
- 2913 Everest Dr
- 2904 Everest Dr
- 2900 Everest Dr
- 1101 Oakgrove Ln
- 2917 Everest Dr
- 2908 Everest Dr
- 2912 Everest Dr
- 1105 Oakgrove Ln
- 2921 Everest Dr
- 2905 Eagles Nest Dr
- 2901 Eagles Nest Dr
- 1029 Harwood Rd
- 1109 Oakgrove Ln
- 2909 Eagles Nest Dr
- 2916 Everest Dr
- 2825 Springhaven Ct
- 2929 Everest Dr
- 1113 Oakgrove Ln