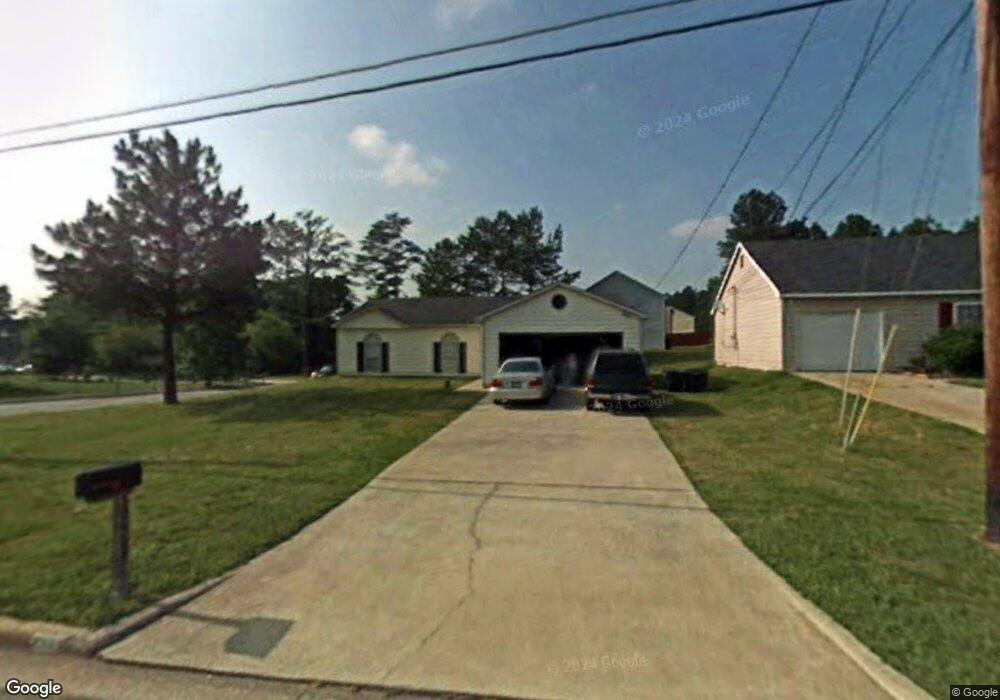
2905 Garnet Way Unit 103 Atlanta, GA 30349
Estimated Value: $217,000 - $254,000
3
Beds
2
Baths
1,224
Sq Ft
$192/Sq Ft
Est. Value
About This Home
This home is located at 2905 Garnet Way Unit 103, Atlanta, GA 30349 and is currently estimated at $234,660, approximately $191 per square foot. 2905 Garnet Way Unit 103 is a home located in Fulton County with nearby schools including Nolan Elementary School, Mcnair Middle School, and Banneker High School.
Ownership History
Date
Name
Owned For
Owner Type
Purchase Details
Closed on
Dec 1, 2021
Sold by
Bass Shonagh
Bought by
Zillow Homes Property Tr
Current Estimated Value
Purchase Details
Closed on
Oct 7, 2019
Sold by
Wgm Partners Llc Trustee
Bought by
Bass Shonagh
Purchase Details
Closed on
Mar 18, 2014
Sold by
Legacy Asset Holdings Llc
Bought by
2905 Garnet Way Land Trust
Purchase Details
Closed on
Aug 23, 2011
Sold by
Federal National Mortgage Association
Bought by
Legacy Asset Holdings Llc
Purchase Details
Closed on
Apr 28, 2009
Sold by
Zenon John A
Bought by
Zenon Geraldine R
Purchase Details
Closed on
Jun 30, 2004
Sold by
Williams Yolanda
Bought by
Zenon John A
Home Financials for this Owner
Home Financials are based on the most recent Mortgage that was taken out on this home.
Original Mortgage
$99,650
Interest Rate
5.38%
Mortgage Type
New Conventional
Purchase Details
Closed on
Jan 20, 1995
Sold by
Kyvest Ltd
Bought by
Williams Yolanda
Create a Home Valuation Report for This Property
The Home Valuation Report is an in-depth analysis detailing your home's value as well as a comparison with similar homes in the area
Home Values in the Area
Average Home Value in this Area
Purchase History
| Date | Buyer | Sale Price | Title Company |
|---|---|---|---|
| Zillow Homes Property Tr | $218,867 | -- | |
| Bass Shonagh | $164,900 | -- | |
| 2905 Garnet Way Land Trust | -- | -- | |
| Legacy Asset Holdings Llc | $20,100 | -- | |
| Zenon Geraldine R | -- | -- | |
| Zenon John A | $104,900 | -- | |
| Williams Yolanda | $70,000 | -- |
Source: Public Records
Mortgage History
| Date | Status | Borrower | Loan Amount |
|---|---|---|---|
| Previous Owner | Zenon John A | $99,650 | |
| Closed | Williams Yolanda | $0 |
Source: Public Records
Tax History Compared to Growth
Tax History
| Year | Tax Paid | Tax Assessment Tax Assessment Total Assessment is a certain percentage of the fair market value that is determined by local assessors to be the total taxable value of land and additions on the property. | Land | Improvement |
|---|---|---|---|---|
| 2025 | $3,380 | $87,760 | $20,920 | $66,840 |
| 2023 | $2,158 | $76,440 | $21,800 | $54,640 |
| 2022 | $2,315 | $59,040 | $12,040 | $47,000 |
| 2021 | $1,893 | $47,280 | $8,040 | $39,240 |
| 2020 | $1,901 | $46,720 | $7,960 | $38,760 |
| 2019 | $1,559 | $39,480 | $6,880 | $32,600 |
| 2018 | $874 | $21,960 | $4,280 | $17,680 |
| 2017 | $781 | $19,160 | $4,240 | $14,920 |
| 2016 | $781 | $19,160 | $4,240 | $14,920 |
| 2015 | $783 | $19,160 | $4,240 | $14,920 |
| 2014 | $769 | $17,840 | $4,160 | $13,680 |
Source: Public Records
Map
Nearby Homes
- 2700 Woodward Rd
- 6278 Rockaway Rd
- 340 Onyx Ct
- 2500 Woodward Rd
- 6265 Gemstone Ct
- 1005 Winter Side Ln Unit 2
- 1005 Winterside Ln
- 2835 Sapphire St
- 6305 Emerald Pointe Cir
- 200 Fox Hall Ct
- 2221 Bigwood Trail
- 6354 Olmadison Place
- 0 Old National Hwy Unit 10585141
- 0 Old National Hwy Unit 25259755
- 0 Old National Hwy Unit 7633279
- 6037 Hemperly Rd
- 6041 Hemperly Rd
- 2401 Bigwood Trail
- 2317 Hackamore Dr
- 2905 Garnet Way
- 2905 Garnet Way
- 2905 Garntet Way Unit 103
- 2895 Garnet Way Unit 1
- 6395 Topaz Trail
- 2925 Garnet Way
- 2885 Garnet Way
- 6385 Topaz Trail
- 2910 Garnet Way Unit 1
- 2900 Garnet Way
- 2920 Garnet Way Unit 1
- 2935 Garnet Way Unit 1
- 2890 Garnet Way Unit 1
- 2890 Garnet Way
- 6375 Topaz Trail
- 2691 Rocky Ct Unit 90
- 6380 Topaz Trail
- 2930 Garnet Way Unit 1
- 6390 Topaz Trail
- 2697 Rocky Ct Unit 91