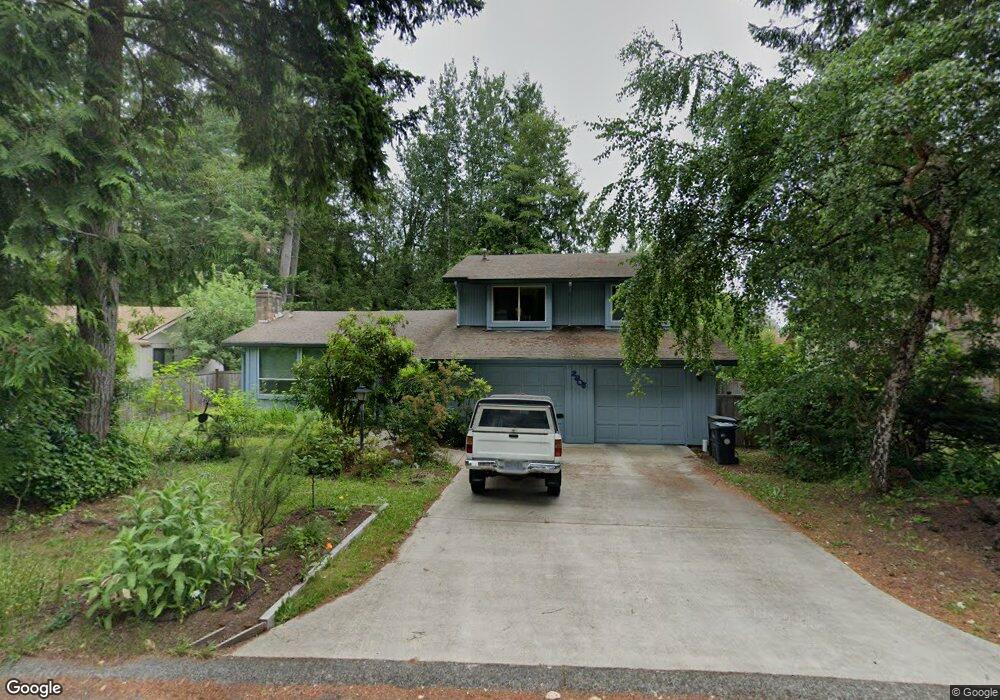
2905 Langridge Loop NW Olympia, WA 98502
Estimated Value: $529,838 - $556,000
3
Beds
3
Baths
1,767
Sq Ft
$306/Sq Ft
Est. Value
About This Home
This home is located at 2905 Langridge Loop NW, Olympia, WA 98502 and is currently estimated at $540,460, approximately $305 per square foot. 2905 Langridge Loop NW is a home located in Thurston County with nearby schools including Garfield Elementary School, Jefferson Middle School, and Capital High School.
Ownership History
Date
Name
Owned For
Owner Type
Purchase Details
Closed on
Jan 5, 2000
Sold by
Coleman Mark Armstrong and Mitchell Cindy Lynn
Bought by
Carroll Martha E
Current Estimated Value
Purchase Details
Closed on
Oct 23, 1998
Sold by
Wheeler Larry B and Wheeler Robin B
Bought by
Coleman Mark Howard and Mitchell Cindy Lynn
Home Financials for this Owner
Home Financials are based on the most recent Mortgage that was taken out on this home.
Original Mortgage
$136,800
Interest Rate
6.71%
Purchase Details
Closed on
Nov 15, 1996
Sold by
Porter J Benson and Porter Julia K
Bought by
Wheeler Larry B and Wheeler Robin B
Home Financials for this Owner
Home Financials are based on the most recent Mortgage that was taken out on this home.
Original Mortgage
$125,600
Interest Rate
7.88%
Mortgage Type
Balloon
Create a Home Valuation Report for This Property
The Home Valuation Report is an in-depth analysis detailing your home's value as well as a comparison with similar homes in the area
Purchase History
| Date | Buyer | Sale Price | Title Company |
|---|---|---|---|
| Carroll Martha E | -- | Chicago Title Insurance Co | |
| Coleman Mark Howard | $144,000 | First American Title Ins Co | |
| Wheeler Larry B | $157,000 | Thurston County Title Co |
Source: Public Records
Mortgage History
| Date | Status | Borrower | Loan Amount |
|---|---|---|---|
| Previous Owner | Coleman Mark Howard | $136,800 | |
| Previous Owner | Wheeler Larry B | $125,600 |
Source: Public Records
Tax History
| Year | Tax Paid | Tax Assessment Tax Assessment Total Assessment is a certain percentage of the fair market value that is determined by local assessors to be the total taxable value of land and additions on the property. | Land | Improvement |
|---|---|---|---|---|
| 2025 | $4,464 | $439,000 | $181,300 | $257,700 |
| 2024 | $4,464 | $440,700 | $169,400 | $271,300 |
| 2023 | $4,464 | $426,700 | $145,300 | $281,400 |
| 2022 | $4,058 | $415,900 | $114,500 | $301,400 |
| 2021 | $3,810 | $339,500 | $98,100 | $241,400 |
| 2020 | $3,569 | $294,900 | $102,400 | $192,500 |
| 2019 | $3,069 | $269,500 | $59,500 | $210,000 |
| 2018 | $3,132 | $232,400 | $56,700 | $175,700 |
| 2017 | $2,721 | $217,550 | $58,150 | $159,400 |
| 2016 | $2,519 | $206,750 | $63,450 | $143,300 |
| 2014 | -- | $201,250 | $63,450 | $137,800 |
Source: Public Records
Map
Nearby Homes
- 2714 Dundee Place NW
- 2225 Dickinson Ave NW
- 923 Sarah Ct NW
- 2016 Dickinson Ave NW
- 1807 Marigold St NW
- 1822 Jonquil Ln NW
- 1910 Bowman Ave NW
- 1203 Bowman Ave NW
- 1827 Cyrene Dr NW
- 1505 Dickinson Ave NW
- 1422 Brawne Ave NW
- 1912 Elliott Ave NW
- 529 Bungalow Dr NW
- 420 Bungalow Dr NW
- 3715 Goldcrest Heights NW
- 1405 Rolling Hills Terrace NW
- 314 Foote St NW
- 2300 9th Ave SW Unit A2
- 816 Soroya Dr SW
- 4218 Goldcrest Dr NW
- 2901 Langridge Loop NW
- 2909 Langridge Loop NW
- 1037 Cardigan Loop NW
- 1039 Cardigan Loop NW
- 1035 Cardigan Loop NW
- 2913 Langridge Loop NW
- 1041 Cardigan Loop NW
- 2914 Langridge Loop NW
- 2839 Langridge Loop NW
- 2917 Langridge Loop NW
- 2832 Langridge Loop NW
- 1033 Cardigan Loop NW
- 1043 Cardigan Loop NW
- 2922 Langridge Loop NW
- 1034 Cardigan Loop NW
- 2835 Langridge Loop NW
- 2921 Langridge Loop NW
- 2601 Walnut Loop NW
- 2603 Walnut Loop NW
- 1040 Cardigan Loop NW
Your Personal Tour Guide
Ask me questions while you tour the home.