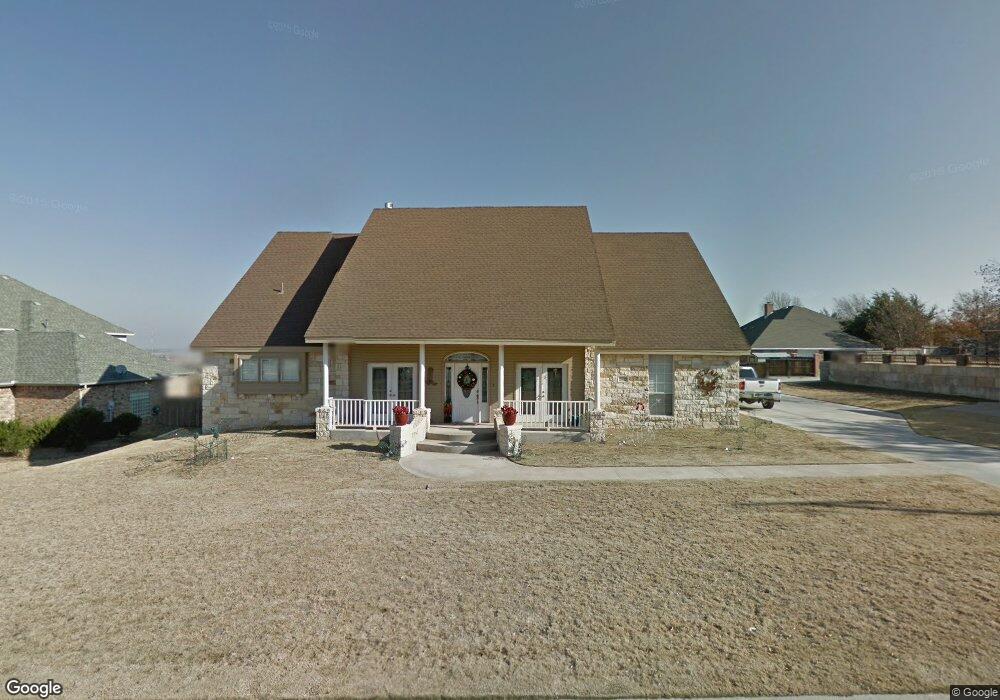
2905 Robb Dr Big Spring, TX 79720
Estimated Value: $365,000 - $428,000
Studio
--
Bath
3,706
Sq Ft
$104/Sq Ft
Est. Value
About This Home
This home is located at 2905 Robb Dr, Big Spring, TX 79720 and is currently estimated at $386,867, approximately $104 per square foot. 2905 Robb Dr is a home located in Howard County with nearby schools including Big Spring High School, St. Mary's Episcopal School, and Nazarene Christian Academy Big Spring.
Ownership History
Date
Name
Owned For
Owner Type
Purchase Details
Closed on
Apr 1, 2025
Sold by
Taylor Beverly Ann and Taylor John L
Bought by
Midfielder Minerals Llc
Current Estimated Value
Purchase Details
Closed on
Jul 2, 2014
Sold by
Estate Of Daniel Z Strickland Iii
Bought by
Romine Gary and Romine Christy
Purchase Details
Closed on
Aug 28, 2008
Sold by
Sodowsky Jess and Sodowsky Lucinda
Bought by
Romine Christy and Romine Gary
Home Financials for this Owner
Home Financials are based on the most recent Mortgage that was taken out on this home.
Original Mortgage
$150,000
Interest Rate
6.54%
Mortgage Type
New Conventional
Purchase Details
Closed on
Feb 12, 2007
Sold by
Strickland & Knight Equipment Company A
Bought by
Sodowsky Jess and Sodowsky Lucinda
Create a Home Valuation Report for This Property
The Home Valuation Report is an in-depth analysis detailing your home's value as well as a comparison with similar homes in the area
Purchase History
| Date | Buyer | Sale Price | Title Company |
|---|---|---|---|
| Midfielder Minerals Llc | -- | None Listed On Document | |
| Romine Gary | -- | Big Spring Abstract & Title | |
| Romine Gary | -- | Big Spring Abstract & Title | |
| Romine Christy | -- | Big Spring Abstract | |
| Sodowsky Jess | -- | None Available |
Source: Public Records
Mortgage History
| Date | Status | Borrower | Loan Amount |
|---|---|---|---|
| Previous Owner | Romine Christy | $150,000 |
Source: Public Records
Tax History
| Year | Tax Paid | Tax Assessment Tax Assessment Total Assessment is a certain percentage of the fair market value that is determined by local assessors to be the total taxable value of land and additions on the property. | Land | Improvement |
|---|---|---|---|---|
| 2025 | $5,413 | $277,619 | $37,370 | $240,249 |
| 2024 | $4,941 | $277,638 | $37,370 | $240,268 |
| 2023 | $5,567 | $315,827 | $33,750 | $282,077 |
| 2022 | $6,650 | $326,817 | $25,000 | $301,817 |
| 2021 | $6,959 | $296,136 | $25,000 | $271,136 |
| 2019 | $6,345 | $250,838 | $25,000 | $225,838 |
| 2018 | $7,550 | $252,009 | $25,000 | $227,009 |
| 2017 | $7,564 | $256,976 | $30,000 | $226,976 |
| 2016 | $7,635 | $259,389 | $30,000 | $229,389 |
| 2015 | -- | $261,806 | $30,000 | $231,806 |
| 2014 | -- | $248,098 | $30,000 | $218,098 |
Source: Public Records
Map
Nearby Homes
- 4 Glenwick Cove
- 700 Highland Dr
- 000 Holland Grace
- 6 Highland Cove
- 603 Scott Dr
- 2904 MacAuslan St
- 512 Highland Dr
- 509 Highland Dr
- 0000 Los Alamitos Trail
- 2809 Goliad St
- 2606 Carol Dr
- 000 Farm To Market Road 700
- TBD Larry Tubb Rd
- 2701 Larry Dr
- 2502 Cindy Ln
- 2604 Ann Dr
- 2710 Shirley Dr
- 2706 Shirley Dr
- 2704 Shirley Dr
- 1800 Brent Dr
- 2901 Robb Dr
- 906 Caprock Dr
- 1101 Highland Dr
- 909 Highland Dr
- 907 Caprock Dr
- 1001 Highland Dr
- 907 Highland Dr
- 1000 Highland Dr
- 905 Caprock Dr
- 908 Highland Dr
- 905 Highland Dr
- 1100 Highland Dr
- 901 Caprock Dr
- 906 Highland Dr
- 1001 Mountain Dr
- 900 Caprock Dr
- 903 Highland Dr
- 909 Mountain Dr
- 907 Mountain Dr
- 714 Caprock Dr
Your Personal Tour Guide
Ask me questions while you tour the home.