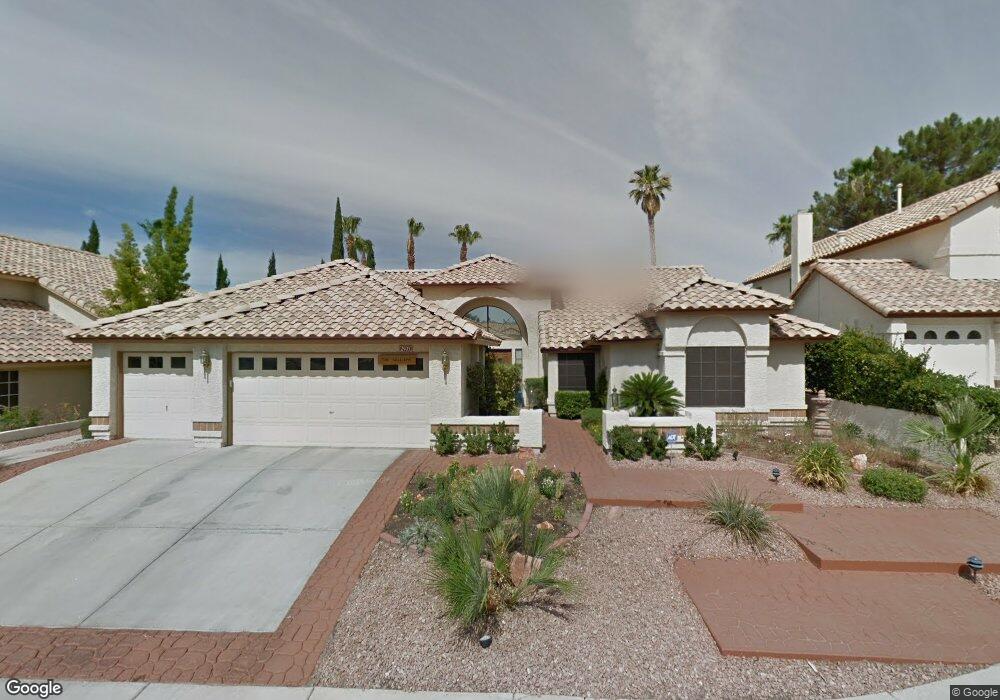
2905 Whalers Cove Cir Las Vegas, NV 89117
The Section Seven NeighborhoodEstimated Value: $650,000 - $871,000
3
Beds
3
Baths
2,516
Sq Ft
$291/Sq Ft
Est. Value
About This Home
This home is located at 2905 Whalers Cove Cir, Las Vegas, NV 89117 and is currently estimated at $733,250, approximately $291 per square foot. 2905 Whalers Cove Cir is a home located in Clark County with nearby schools including D'Vorre & Hal Ober Elementary School, Victoria Fertitta Middle School, and Bonanza High School.
Ownership History
Date
Name
Owned For
Owner Type
Purchase Details
Closed on
Nov 9, 2016
Sold by
Williams Roger E and Williams Judith N
Bought by
Williams Roger E and Williams Judith N
Current Estimated Value
Purchase Details
Closed on
Dec 22, 2010
Sold by
Flippen Joseph R and Metzger Ann M
Bought by
Williams Roger E and Williams Judith N
Purchase Details
Closed on
Apr 10, 2006
Sold by
Metzger Ann M and Flippen Joseph R
Bought by
Flippen Joseph R and Metzger Ann M
Purchase Details
Closed on
May 11, 1999
Sold by
Altig Steven J and Altig Bonnie L
Bought by
Flippen Joseph R and Metzge Ann M
Home Financials for this Owner
Home Financials are based on the most recent Mortgage that was taken out on this home.
Original Mortgage
$118,000
Interest Rate
7.2%
Create a Home Valuation Report for This Property
The Home Valuation Report is an in-depth analysis detailing your home's value as well as a comparison with similar homes in the area
Home Values in the Area
Average Home Value in this Area
Purchase History
| Date | Buyer | Sale Price | Title Company |
|---|---|---|---|
| Williams Roger E | -- | None Available | |
| Williams Roger E | $275,000 | Equity Title Of Nevada | |
| Flippen Joseph R | -- | None Available | |
| Flippen Joseph R | $238,000 | Fidelity National Title Agen |
Source: Public Records
Mortgage History
| Date | Status | Borrower | Loan Amount |
|---|---|---|---|
| Previous Owner | Flippen Joseph R | $118,000 |
Source: Public Records
Tax History Compared to Growth
Tax History
| Year | Tax Paid | Tax Assessment Tax Assessment Total Assessment is a certain percentage of the fair market value that is determined by local assessors to be the total taxable value of land and additions on the property. | Land | Improvement |
|---|---|---|---|---|
| 2025 | $3,102 | $142,878 | $59,850 | $83,028 |
| 2024 | $3,012 | $142,878 | $59,850 | $83,028 |
| 2023 | $3,012 | $132,688 | $52,850 | $79,838 |
| 2022 | $2,930 | $113,595 | $39,900 | $73,695 |
| 2021 | $2,847 | $106,418 | $35,700 | $70,718 |
| 2020 | $2,760 | $104,861 | $34,300 | $70,561 |
| 2019 | $2,679 | $98,640 | $28,700 | $69,940 |
| 2018 | $2,602 | $100,612 | $32,550 | $68,062 |
| 2017 | $3,262 | $102,129 | $32,550 | $69,579 |
| 2016 | $2,462 | $93,193 | $23,100 | $70,093 |
| 2015 | $2,458 | $88,467 | $18,900 | $69,567 |
| 2014 | $2,381 | $72,901 | $12,250 | $60,651 |
Source: Public Records
Map
Nearby Homes
- 2909 Ivory Reef Ct
- 2821 Willow Wind Ct
- 3001 Bridge Creek St
- 3026 Cherum St
- 9724 Cascade Falls Ave
- 9708 Blazing Star Ct
- 2704 Messina Ct
- 9713 Cascade Falls Ave
- 10191 Refuge Ct Unit 2
- 10025 Harpoon Cir
- 9717 Sierra Mesa Ave
- 10028 Sail Landing Ct
- 2630 Wind Spinner St
- 2728 Monrovia Dr
- 2724 Monrovia Dr
- 10281 Rarity Ave
- 9624 Beach Water Cir
- 10024 Rolling Glen Ct
- 9612 Chianti Ln
- 9605 Blowing Sand Cir
- 2909 Whalers Cove Cir
- 2901 Whalers Cove Cir
- 2904 Ivory Reef Ct
- 2913 Whalers Cove Cir
- 2900 Ivory Reef Ct
- 2908 Ivory Reef Ct
- 9945 Coral Sands Dr
- 9941 Coral Sands Dr
- 2908 Whalers Cove Cir
- 9949 Coral Sands Dr
- 2912 Whalers Cove Cir Unit n/a
- 2912 Whalers Cove Cir
- 9937 Coral Sands Dr
- 2912 Ivory Reef Ct
- 9953 Coral Sands Dr
- 2904 Whalers Cove Cir
- 2916 Whalers Cove Cir Unit A
- 9933 Coral Sands Dr
- 2900 Whalers Cove Cir
- 9957 Coral Sands Dr Unit 2