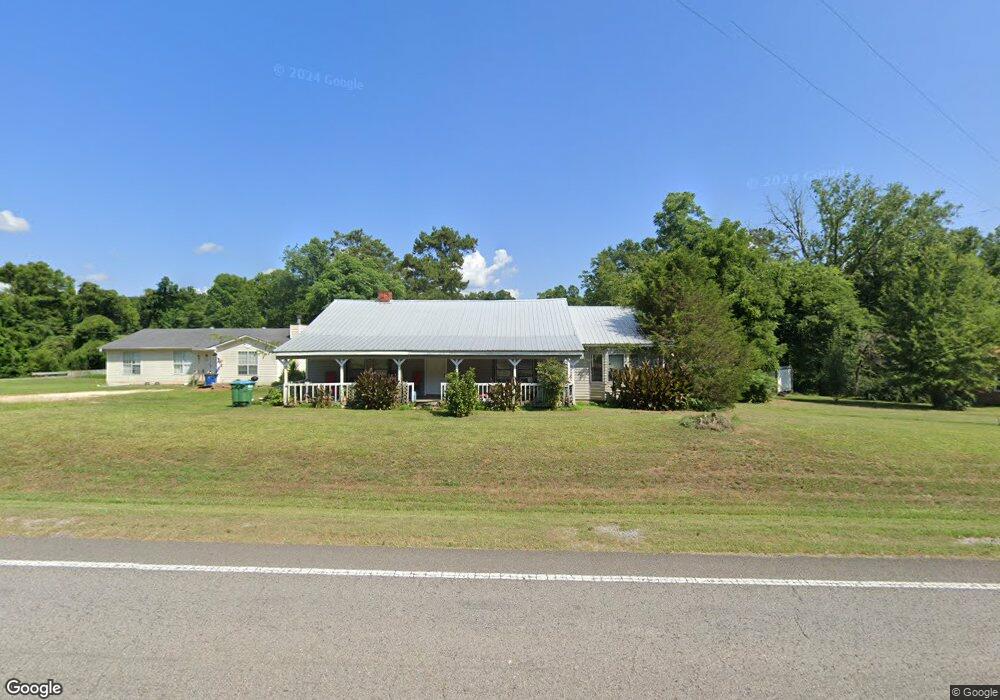
29056 State Highway 79 Locust Fork, AL 35097
Estimated Value: $180,556 - $354,000
--
Bed
--
Bath
1,847
Sq Ft
$135/Sq Ft
Est. Value
About This Home
This home is located at 29056 State Highway 79, Locust Fork, AL 35097 and is currently estimated at $249,639, approximately $135 per square foot. 29056 State Highway 79 is a home located in Blount County with nearby schools including Locust Fork Elementary School and Locust Fork High School.
Ownership History
Date
Name
Owned For
Owner Type
Purchase Details
Closed on
Oct 16, 2013
Sold by
Secretary Housing And Urban Development
Bought by
Denard Matthew L
Current Estimated Value
Purchase Details
Closed on
Oct 30, 2012
Sold by
Bank Of America Na
Bought by
Secretary Housing Urban Development W Dc
Purchase Details
Closed on
Dec 19, 2006
Sold by
Simpson Jesse and Simpson Melinda
Bought by
Hood Singleton David T and Hood Lowery Tammy
Home Financials for this Owner
Home Financials are based on the most recent Mortgage that was taken out on this home.
Original Mortgage
$98,356
Interest Rate
6.1%
Mortgage Type
Purchase Money Mortgage
Purchase Details
Closed on
Oct 18, 2005
Sold by
Simpson Melinda H
Bought by
Simpson Jesse and Simpson Melinda H
Home Financials for this Owner
Home Financials are based on the most recent Mortgage that was taken out on this home.
Original Mortgage
$80,000
Interest Rate
5.76%
Mortgage Type
Purchase Money Mortgage
Create a Home Valuation Report for This Property
The Home Valuation Report is an in-depth analysis detailing your home's value as well as a comparison with similar homes in the area
Home Values in the Area
Average Home Value in this Area
Purchase History
| Date | Buyer | Sale Price | Title Company |
|---|---|---|---|
| Denard Matthew L | $13,200 | -- | |
| Secretary Housing Urban Development W Dc | $144,591 | -- | |
| Hood Singleton David T | $99,900 | -- | |
| Simpson Jesse | -- | -- |
Source: Public Records
Mortgage History
| Date | Status | Borrower | Loan Amount |
|---|---|---|---|
| Previous Owner | Hood Singleton David T | $98,356 | |
| Previous Owner | Simpson Jesse | $80,000 |
Source: Public Records
Tax History Compared to Growth
Tax History
| Year | Tax Paid | Tax Assessment Tax Assessment Total Assessment is a certain percentage of the fair market value that is determined by local assessors to be the total taxable value of land and additions on the property. | Land | Improvement |
|---|---|---|---|---|
| 2024 | $1,124 | $29,960 | $2,000 | $27,960 |
| 2023 | $1,124 | $27,780 | $2,000 | $25,780 |
| 2022 | $954 | $25,440 | $2,000 | $23,440 |
| 2021 | $802 | $21,380 | $2,100 | $19,280 |
| 2020 | $767 | $18,780 | $2,000 | $16,780 |
| 2019 | $704 | $18,780 | $2,000 | $16,780 |
| 2018 | $752 | $20,040 | $2,000 | $18,040 |
| 2017 | $707 | $18,860 | $0 | $0 |
| 2015 | $354 | $9,440 | $0 | $0 |
| 2014 | -- | $9,440 | $0 | $0 |
| 2013 | -- | $0 | $0 | $0 |
Source: Public Records
Map
Nearby Homes
- 29542 Alabama 79
- 89 Pine Tree Dr
- #0 Shady Point Rd
- 3251 County Highway 13
- 159 Ray Dr
- 178 Jerry Marsh Rd
- 380 Jerry Marsh Rd
- 0 Center Hill Rd Unit 21411639
- 31730 Alabama 79
- 496 Tawbush Rd
- 25942 Alabama 79
- 2898 County Highway 15
- 265 Riverview Dr
- 1129 Baty Rd
- 32510 Alabama 79
- 640 Gilman Bend Rd
- 25335 Alabama 79
- 25335 State Highway 79
- 707 Saint Andrews Pkwy
- 87 Youngblood Ln
- 29056 Alabama 79
- 29066 State Highway 79
- 29020 State Highway 79
- 29013 State Highway 79
- 99 Crider Rd
- 0 Alabama 79 Unit 21384291
- 0 Alabama 79 Unit 12.5 AC 598269
- 1 parcel Alabama 79
- 0 Alabama 79
- 185 Reed Ln
- 00 Alabama 79
- 00 Alabama 79 Unit 1
- 91 Tabernacle Rd
- 159 Crider Rd
- 287 Reed Ln
- 253 Reed Ln
- 29273 State Highway 79
- 283 Reed Ln
- 27 Azelle Cir
- 29297 State Highway 79