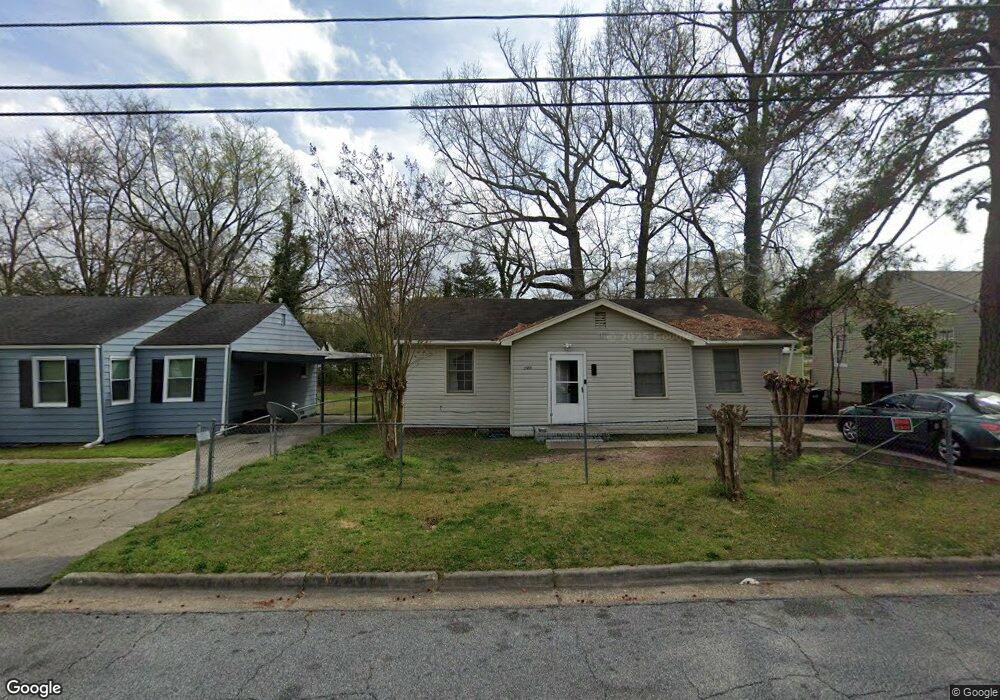
2906 Pecan St Columbus, GA 31906
Estimated Value: $59,030 - $102,000
3
Beds
2
Baths
1,125
Sq Ft
$68/Sq Ft
Est. Value
About This Home
This home is located at 2906 Pecan St, Columbus, GA 31906 and is currently estimated at $76,758, approximately $68 per square foot. 2906 Pecan St is a home located in Muscogee County with nearby schools including Rigdon Road Elementary School, Rothschild Leadership Academy, and Carver High School.
Ownership History
Date
Name
Owned For
Owner Type
Purchase Details
Closed on
Oct 17, 2008
Sold by
Secretary Of Housing & Urban Development
Bought by
Margrace Llc
Current Estimated Value
Home Financials for this Owner
Home Financials are based on the most recent Mortgage that was taken out on this home.
Original Mortgage
$23,213
Interest Rate
5.78%
Mortgage Type
Purchase Money Mortgage
Purchase Details
Closed on
Nov 6, 2007
Sold by
Suntrust Mortgage Inc
Bought by
Hud
Create a Home Valuation Report for This Property
The Home Valuation Report is an in-depth analysis detailing your home's value as well as a comparison with similar homes in the area
Home Values in the Area
Average Home Value in this Area
Purchase History
| Date | Buyer | Sale Price | Title Company |
|---|---|---|---|
| Margrace Llc | -- | None Available | |
| Hud | -- | None Available | |
| Suntrust Mortgage Inc | $40,788 | None Available |
Source: Public Records
Mortgage History
| Date | Status | Borrower | Loan Amount |
|---|---|---|---|
| Closed | Margrace Llc | $23,213 |
Source: Public Records
Tax History Compared to Growth
Tax History
| Year | Tax Paid | Tax Assessment Tax Assessment Total Assessment is a certain percentage of the fair market value that is determined by local assessors to be the total taxable value of land and additions on the property. | Land | Improvement |
|---|---|---|---|---|
| 2025 | $460 | $29,040 | $3,616 | $25,424 |
| 2024 | $460 | $11,756 | $3,616 | $8,140 |
| 2023 | $463 | $11,756 | $3,616 | $8,140 |
| 2022 | $229 | $11,756 | $3,616 | $8,140 |
| 2021 | $229 | $5,620 | $3,616 | $2,004 |
| 2020 | $230 | $5,620 | $3,616 | $2,004 |
| 2019 | $548 | $13,376 | $3,616 | $9,760 |
| 2018 | $548 | $13,376 | $3,616 | $9,760 |
| 2017 | $550 | $13,376 | $3,616 | $9,760 |
| 2016 | $528 | $12,789 | $2,088 | $10,701 |
| 2015 | $528 | $12,789 | $2,088 | $10,701 |
| 2014 | $529 | $12,789 | $2,088 | $10,701 |
| 2013 | -- | $16,909 | $2,088 | $14,821 |
Source: Public Records
Map
Nearby Homes