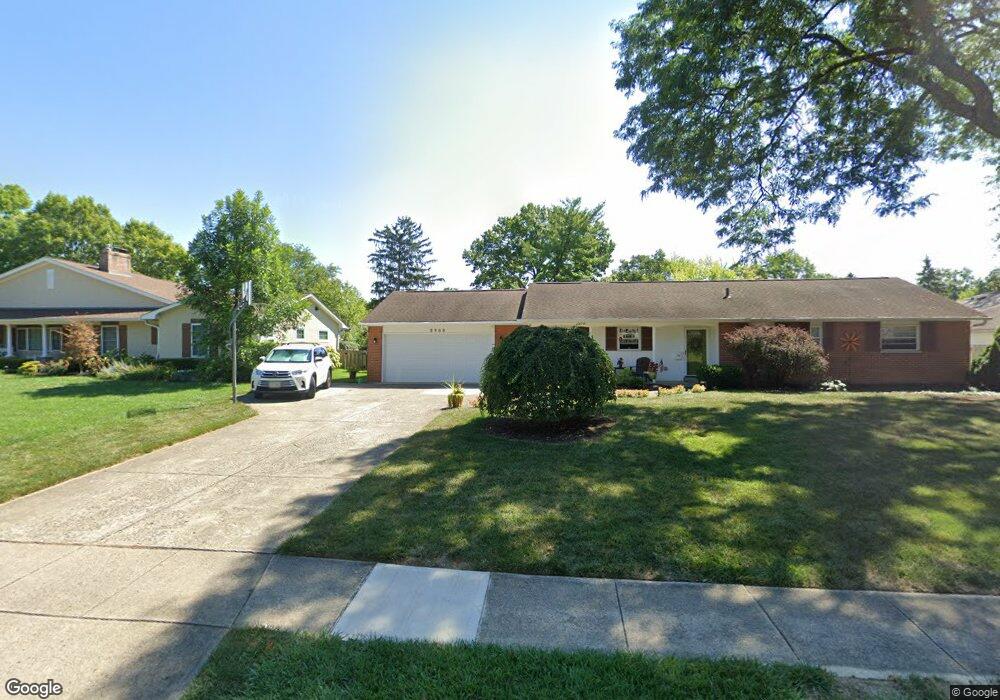
2906 Pickwick Dr Columbus, OH 43221
Estimated Value: $576,000 - $666,000
3
Beds
2
Baths
1,916
Sq Ft
$324/Sq Ft
Est. Value
About This Home
This home is located at 2906 Pickwick Dr, Columbus, OH 43221 and is currently estimated at $621,613, approximately $324 per square foot. 2906 Pickwick Dr is a home located in Franklin County with nearby schools including Tremont Elementary School, Jones Middle School, and Upper Arlington High School.
Ownership History
Date
Name
Owned For
Owner Type
Purchase Details
Closed on
Aug 29, 2001
Sold by
Wile Michael R and Wile Lois J
Bought by
Bergen Kevin R and Bergen Pamela Ann
Current Estimated Value
Purchase Details
Closed on
Aug 27, 1997
Sold by
Wile Michael R and Hinckley Lois J
Bought by
Wile Michael R and Wile Lois J
Home Financials for this Owner
Home Financials are based on the most recent Mortgage that was taken out on this home.
Original Mortgage
$111,600
Outstanding Balance
$14,133
Interest Rate
7.12%
Estimated Equity
$607,480
Purchase Details
Closed on
Jul 23, 1992
Purchase Details
Closed on
Apr 6, 1992
Create a Home Valuation Report for This Property
The Home Valuation Report is an in-depth analysis detailing your home's value as well as a comparison with similar homes in the area
Home Values in the Area
Average Home Value in this Area
Purchase History
| Date | Buyer | Sale Price | Title Company |
|---|---|---|---|
| Bergen Kevin R | $230,000 | Lawyers Title | |
| Wile Michael R | -- | Transohio Title | |
| -- | $165,000 | -- | |
| -- | -- | -- |
Source: Public Records
Mortgage History
| Date | Status | Borrower | Loan Amount |
|---|---|---|---|
| Open | Wile Michael R | $111,600 |
Source: Public Records
Tax History
| Year | Tax Paid | Tax Assessment Tax Assessment Total Assessment is a certain percentage of the fair market value that is determined by local assessors to be the total taxable value of land and additions on the property. | Land | Improvement |
|---|---|---|---|---|
| 2025 | $10,314 | $175,150 | $74,520 | $100,630 |
| 2024 | $10,314 | $175,150 | $74,520 | $100,630 |
| 2023 | $10,189 | $175,150 | $74,520 | $100,630 |
| 2022 | $10,219 | $146,240 | $57,370 | $88,870 |
| 2021 | $9,180 | $146,240 | $57,370 | $88,870 |
| 2020 | $8,966 | $146,240 | $57,370 | $88,870 |
| 2019 | $8,645 | $122,510 | $57,370 | $65,140 |
| 2018 | $7,698 | $122,510 | $57,370 | $65,140 |
| 2017 | $8,555 | $122,510 | $57,370 | $65,140 |
| 2016 | $6,806 | $101,050 | $41,410 | $59,640 |
| 2015 | $6,774 | $101,050 | $41,410 | $59,640 |
| 2014 | $6,683 | $101,050 | $41,410 | $59,640 |
| 2013 | $3,240 | $91,840 | $37,625 | $54,215 |
Source: Public Records
Map
Nearby Homes
- 2803 N Star Rd
- 1485 Trentwood Rd
- 3190 Kenny Rd
- 2585 Westmont Blvd
- 1530 Pemberton Dr
- 1744 Ridgecliff Rd Unit 12
- 1763-1769 Ardleigh Rd Unit 1763-1769
- 1872 Kentwell Rd Unit 1872
- 1121 Afton Rd
- 3106 Somerford Rd
- 1842 Ridgecliff Rd
- 3418 Sunningdale Way
- 1508 Berkshire Rd
- 1565 Berkshire Rd
- 727 Kettering Rd
- 2583 Wexford Rd
- 1869 Tewksbury Rd
- 1224 Kenbrook Hills Dr Unit 25
- 3194 Mountview Rd
- 2165 S Parkway Dr
- 2916 Pickwick Dr
- 2896 Pickwick Dr
- 2905 North Star Rd
- 2893 North Star Rd
- 2926 Pickwick Dr
- 2884 Pickwick Dr
- 2893 N Star Rd
- 2917 North Star Rd
- 2917 N Star Rd
- 2909 Pickwick Dr
- 2881 N Star Rd
- 2881 North Star Rd
- 2897 Pickwick Dr
- 2919 Pickwick Dr
- 2940 Pickwick Dr
- 2872 Pickwick Dr
- 2885 Pickwick Dr
- 2929 Pickwick Dr
- 2929 North Star Rd
- 2869 North Star Rd
Your Personal Tour Guide
Ask me questions while you tour the home.