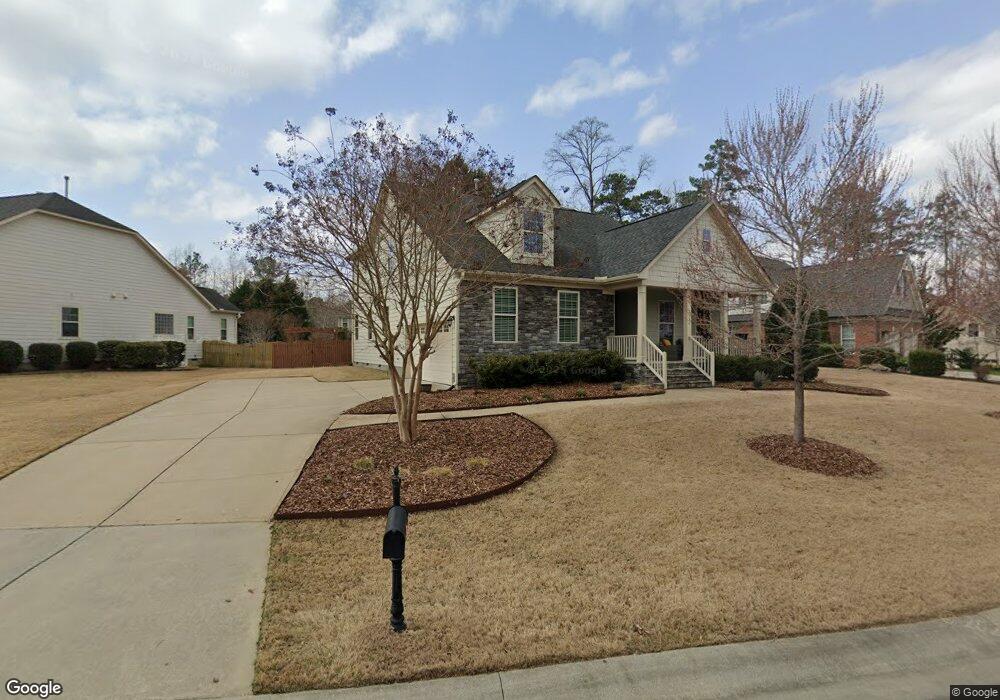
2906 Reynolda Cir Durham, NC 27712
North Durham NeighborhoodEstimated Value: $644,542 - $688,000
4
Beds
4
Baths
2,880
Sq Ft
$232/Sq Ft
Est. Value
About This Home
This home is located at 2906 Reynolda Cir, Durham, NC 27712 and is currently estimated at $669,386, approximately $232 per square foot. 2906 Reynolda Cir is a home located in Durham County with nearby schools including Hillandale Elementary School, George L Carrington Middle, and Riverside High School.
Ownership History
Date
Name
Owned For
Owner Type
Purchase Details
Closed on
Jul 9, 2018
Sold by
Talley Felicia B and Amos Eric
Bought by
Bocian Patricia A
Current Estimated Value
Home Financials for this Owner
Home Financials are based on the most recent Mortgage that was taken out on this home.
Original Mortgage
$300,000
Outstanding Balance
$260,570
Interest Rate
4.6%
Mortgage Type
New Conventional
Estimated Equity
$408,816
Purchase Details
Closed on
Mar 22, 2013
Sold by
Citizens Homes Inc
Bought by
Talley Felicia B
Home Financials for this Owner
Home Financials are based on the most recent Mortgage that was taken out on this home.
Original Mortgage
$238,095
Interest Rate
3.5%
Mortgage Type
FHA
Purchase Details
Closed on
Jun 10, 2011
Sold by
The Manson Company Inc
Bought by
Atlas Nc I Spe Llc
Create a Home Valuation Report for This Property
The Home Valuation Report is an in-depth analysis detailing your home's value as well as a comparison with similar homes in the area
Home Values in the Area
Average Home Value in this Area
Purchase History
| Date | Buyer | Sale Price | Title Company |
|---|---|---|---|
| Bocian Patricia A | $400,000 | None Available | |
| Talley Felicia B | $304,000 | None Available | |
| Atlas Nc I Spe Llc | $440,000 | None Available |
Source: Public Records
Mortgage History
| Date | Status | Borrower | Loan Amount |
|---|---|---|---|
| Open | Bocian Patricia A | $300,000 | |
| Previous Owner | Talley Felicia B | $238,095 |
Source: Public Records
Tax History
| Year | Tax Paid | Tax Assessment Tax Assessment Total Assessment is a certain percentage of the fair market value that is determined by local assessors to be the total taxable value of land and additions on the property. | Land | Improvement |
|---|---|---|---|---|
| 2025 | $6,394 | $645,011 | $121,500 | $523,511 |
| 2024 | $5,121 | $367,091 | $67,600 | $299,491 |
| 2023 | $4,809 | $367,091 | $67,600 | $299,491 |
| 2022 | $4,698 | $367,091 | $67,600 | $299,491 |
| 2021 | $4,676 | $367,091 | $67,600 | $299,491 |
| 2020 | $4,566 | $367,091 | $67,600 | $299,491 |
| 2019 | $4,566 | $367,091 | $67,600 | $299,491 |
| 2018 | $3,620 | $266,849 | $54,080 | $212,769 |
| 2017 | $3,593 | $266,849 | $54,080 | $212,769 |
| 2016 | $3,472 | $266,849 | $54,080 | $212,769 |
| 2015 | $4,685 | $338,407 | $95,288 | $243,119 |
| 2014 | $4,685 | $338,407 | $95,288 | $243,119 |
Source: Public Records
Map
Nearby Homes
- 3026 Rosebriar Dr
- 1113 Umstead Grove Way
- 405 Latta Rd
- 411 Latta Cir
- 1016 Skyler Ln
- 9 Otters Run
- 5005 Gatewood Dr
- 1011 Umstead Rd
- 1013 Umstead Rd
- 1 Signet Dr Unit A17
- 1708 Mystic Dr
- 337 Latta Rd
- 5022 Green Oak Dr
- 3775 Guess Rd Unit 43
- 5018 Gatewood Dr
- 1918 Peppertree St
- 2222 Umstead Rd
- 5023 Pine Trail Dr
- 403 Bonhill Dr
- 913 Woodside Park Ln
- 2904 Reynolda Cir
- 2914 Reynolda Cir
- 2902 Reynolda Cir
- 2905 Reynolda Cir
- 2905 Reynolda Cir Unit 41
- 2804 Reynolda Cir
- 2909 Reynolda Cir
- 2903 Reynolda Cir
- 2903 Reynolda Cir Unit 42
- 2907 Reynolda Cir
- 2907 Reynolda Cir Unit 40
- 2810 Reynolda Cir
- 2901 Reynolda Cir
- 2806 Reynolda Cir
- 2911 Reynolda Cir
- 2802 Reynolda Cir
- 2913 Reynolda Cir
- 33 Reynolda Cir
- 34 Reynolda Cir
- 4201 Scottsdale St
Your Personal Tour Guide
Ask me questions while you tour the home.